
Figures & data
Figure 1 Participant flow from baseline to 18-month follow-up.
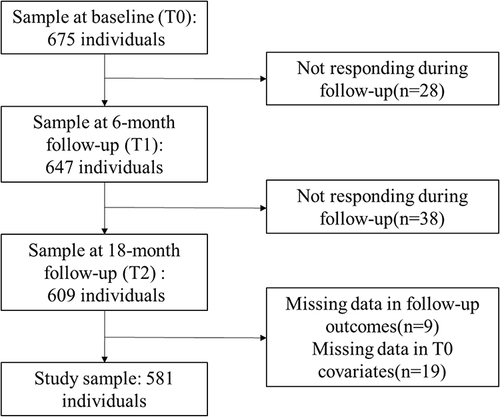
Table 1 Participant Characteristics by Outcome Variables
Table 2 Fit Statistics for 1- to 5-Class Solutions as Derived from LCA at Time Points T0 and T1
Figure 2 Item response probabilities by latent classes.
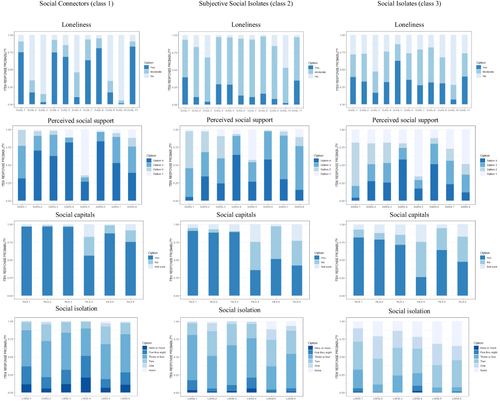
Figure 3 Latent transition probabilities based on the estimated model.This figure shows the transition proportions between latent classes from T0 to T1. The values beside the arrow lines indicate the percentage of participants transitioning between classes.
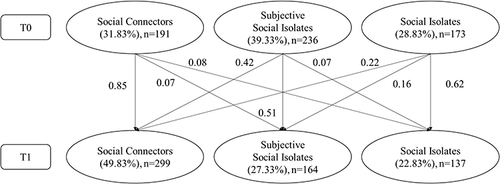
Table 3 Participant Characteristics by Latent Transition Categories
Table 4 Multivariable Logistic Regression Models of Associations Between Latent Transition Categories and Depression, Anxiety and Stress