
Figures & data
Figure 1 Partial least squares structural equation modeling (PLS-SEM) results.
Note: presents results of path coefficients (bold arrows), R2 (purple circle), and outer loading’s significant (light arrows).
Abbreviations: NORA, Non-Organizational Religious Activity; ORA, Organizational Religious Activity.
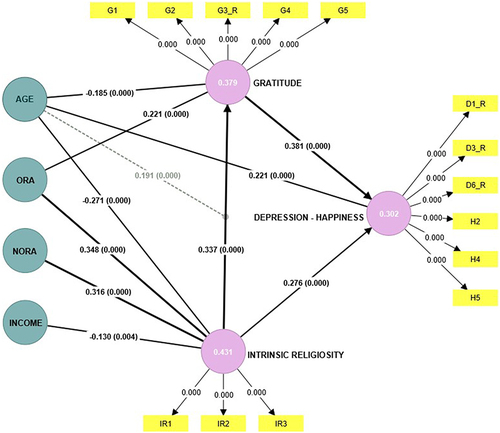
Table 1 Demographic Characteristics
Table 2 Mean, Standard Deviation, Construct Correlations, Reliability, and Validity
Table 3 Heterotrait-Monotrait Ratios (HTMT)
Table 4 Path Coefficients