Figures & data
Table 1 Demographic data of healthy (N=43) and dysphagic (N=17) subjects
Table 2 Body mass index data for healthy (N=43) and dysphagic (N=17) subjects
Table 3 Quantitative summary of errors for the four verbal fluency taste categories (sweet, salty, sour, and bitter) for the group of 43 healthy subjects
Table 4 Breakdown and list of errors (egocentric, miscellaneous, and repetition error types) for the four verbal fluency taste categories (sweet, salty, sour, and bitter) for the group of 43 healthy subjects
Table 5 Comparison of the empirical cumulative distribution functions for the combined group of 60 subjects
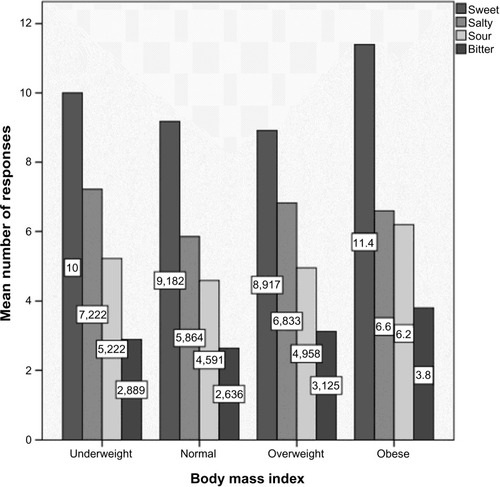
Figure 1 Breakdown of mean number of responses into the four body mass index groups (underweight, normal, overweight, and obese) for each of the four verbal fluency taste categories (sweet, salty, sour, and bitter) and for the combined group of 60 subjects (healthy, 43; dysphagic, 17).