
Figures & data
Table 1 Nations of birth and current residence
Table 2 Belief in an afterlife
Figure 1 Expected age of death.
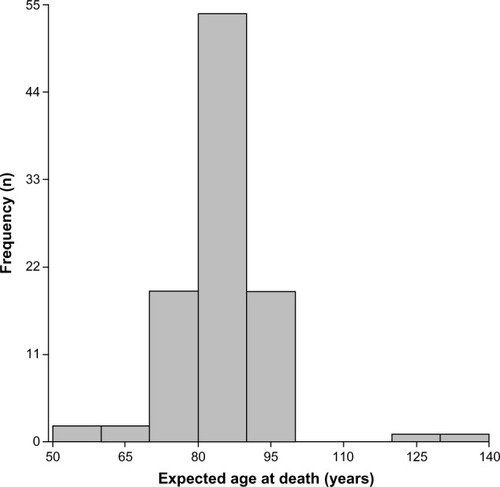
Table 3 Pearson product-moment correlations among attitudinal variables
Table 4 Sex-related differences in attitudes toward the future
Table 5 Degree to which companies rely on different variables in developing theories of longevity
Table 6 How companies adjust their theories of longevity
Table 7 How respondents influence their companies’ theories of longevity
Table 8 How respondents develop personal theories of longevity
Figure 2 Expected retirement age (women).
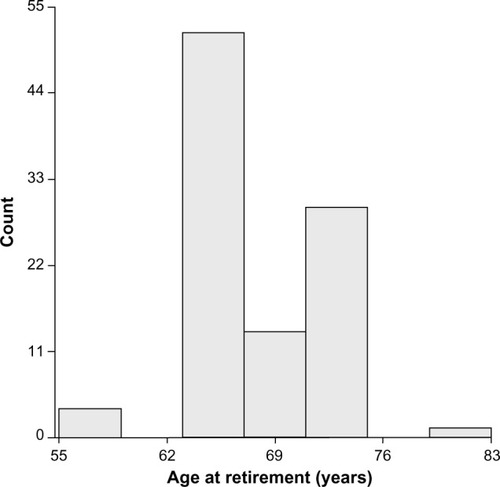
Table 9 Respondent willingness to engage in therapies to reach 150 years of age
Figure 3 Age which respondents would desire to reach, given supporting technology.
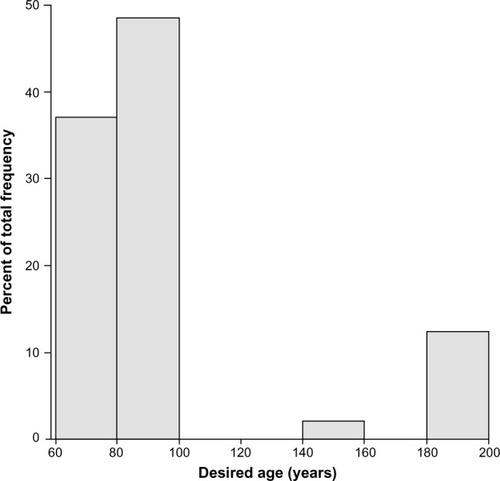
Table S1 Survey questions and response options