Figures & data
Table 1 Number, diameter, and volume of tumors in both rat groups
Table 2 Comparison between both groups with the Mann–Whitney U-test, significant difference P<0.05
Figure 1 Comparison between the level of corticosterone in the group with CIC and CIIC.
Abbreviations: CIC, cancer induction condition; CIIC, cancer induction and isolation condition; SE, standard error; vs, versus.
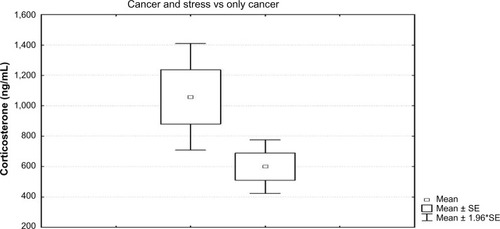
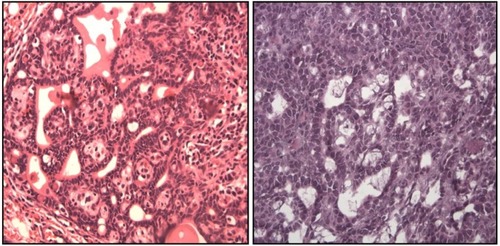
Figure 2 Histopathologic characteristics.
Notes: In the tumor of CIC group, the neoplastic cells have smaller nucleus and increased tubule formation. Mast cells infiltrating the tumor are observed (×40). Tumor of CIIC group shows abundant cellularity (40×), lower degree of histological differentiation, areas more solid without inflammation, cells with larger nucleus and less cytoplasm; indicating a process of division more active.
Abbreviations: CIC, cancer induction condition; CIIC, cancer induction and isolation condition.
Abbreviations: CIC, cancer induction condition; CIIC, cancer induction and isolation condition.