Figures & data
Table 1 Descriptive statistic, Cronbach’s α, and intercorrelations among variables under study
Table 2 Hierarchical regression analysis of perceived stress (PSS)
Table 3 Hierarchical regression analysis of life satisfaction (SWLS)
Figure 1 Effect of coping flexibility on perceived stress, mediated by optimism (sex and age entered as controls but not shown in the diagram).
Note:
**P<0.01.
Abbreviations: β, standardized β coefficient; CFS, Coping Flexibility Scale; LOT-R, Life Orientation Test-Revised; ns, non-significant; PSS, Perceived Stress Scale; SE, standard error.
Abbreviations: β, standardized β coefficient; CFS, Coping Flexibility Scale; LOT-R, Life Orientation Test-Revised; ns, non-significant; PSS, Perceived Stress Scale; SE, standard error.
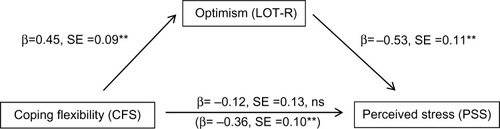
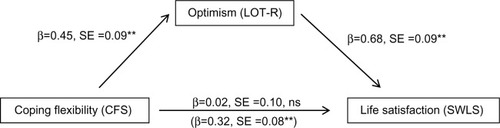
Figure 2 Effect of coping flexibility on life satisfaction, mediated by optimism (sex and age entered as controls but not shown in the diagram).
Note:
**P<0.01.
Abbreviations: β, standardized β coefficient; CFS, Coping Flexibility Scale; LOT-R, Life Orientation Test-Revised; ns, non-significant; SE, standard error; SWLS, Satisfaction with Life Scale.
Abbreviations: β, standardized β coefficient; CFS, Coping Flexibility Scale; LOT-R, Life Orientation Test-Revised; ns, non-significant; SE, standard error; SWLS, Satisfaction with Life Scale.