
Figures & data
Figure 1 Summary of the main steps of the health and life path of rare disease patients and examples of associated characteristics or difficulties.
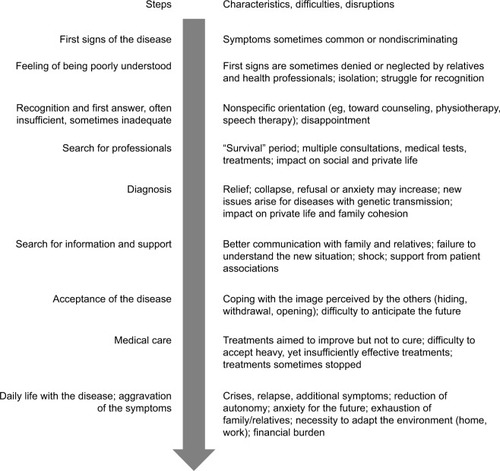
Table 1 Characteristics of the patients
Figure 2 Age at the first signs of the disease (A) and duration of delays in diagnosis (percentage of patients) (B).
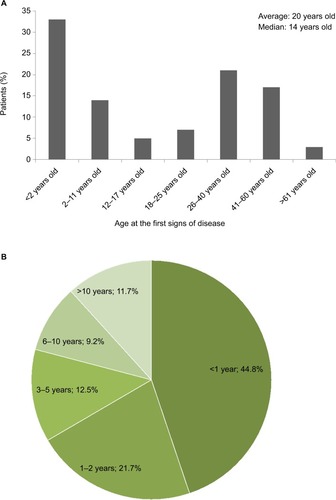
Figure 3 Perception of medical care.
Note: This figure shows an English translation of the original version of these questions, which were presented in French.
Abbreviation: RD, rare disease.
Abbreviation: RD, rare disease.
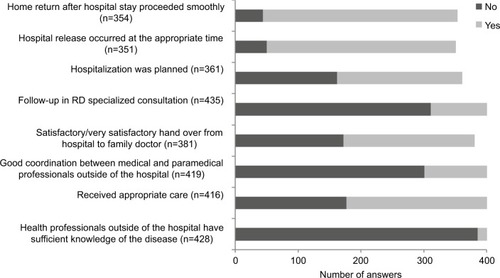
Table 2 Patients’ needs
Table 3 School and work situation
Table 4 Psychological, emotional and family aspects associated with the disease
Figure 4 Comparison between answers of patients followed in an SC (black bars) and patients not followed in an SC (gray bars).
Notes: *Percentage of patients who answered ‘yes’. All answers are significantly different between the two populations. This figure shows an English translation of the original version of these questions, which were presented in French.
Abbreviation: SC, specialized consultation.
Abbreviation: SC, specialized consultation.
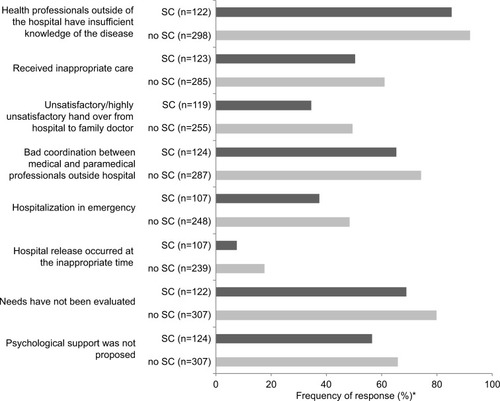
Table 5 Summary of the key conclusions from the 2015 barometer