
Figures & data
Table 1 Cohort characteristics based on highest service rank achieveda
Figure 1 Knowledge score distribution within cohort histogram representing the overall breakdown of the total knowledge score of the hip and knee osteoarthritis decision quality instrument (HK-DQI). The greatest number of subjects (8) scored in the 0.6 (or 60%) percentile.
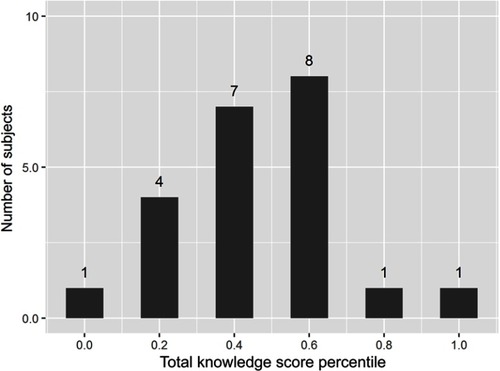
Figure 2 Association of knowledge score and duration of military service correlation plot showing the significant association between increasing total knowledge score with increased number of years served in the military. The R2 of 0.36 shows the amount of variance in total knowledge score accounted for by years served in the military. With a p-value of 0.004, this represents a significant association.
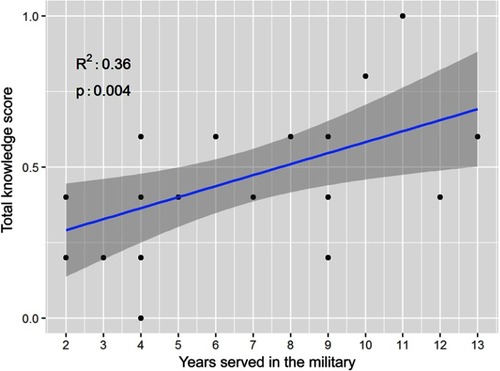
Table 2 Service characteristics and HK-DQI results