Figures & data
Figure 1 Assessment schedule for the modified Severity of Dyspepsia Assessment pain scale and validation items.
Abbreviations: mSODA, modified Severity of Dyspepsia Assessment pain scale; HSSR, Heartburn Symptom Severity Rating; WK, week; MDHAQ, Multi-Dimensional Health Assessment Questionnaire.
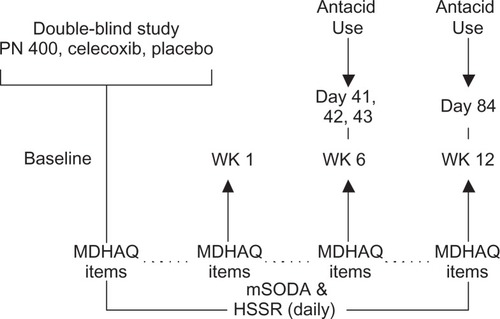
Figure 2 Modified Severity of Dyspepsia Assessment pain scale.
Copyright © 2011, AstraZeneca.
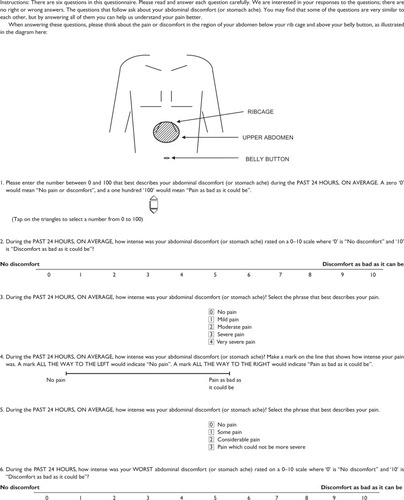
Table 1 Demographic characteristics of study population
Table 2 Means and standard deviations across assessments for the modified Severity of Dyspepsia Assessment pain scale and validation items
Table 3 Modified Severity of Dyspepsia Assessment construct validity (known-groups)
Table 4 Modified Severity of Dyspepsia Assessment responsiveness at week 6 and week 12