Figures & data
Table 1 Patient characteristics at baseline (n=45)
Figure 1 Bland–Altman plot.
Notes: Intraindividual differences between the Fear-Avoidance Belief Questionnaire for physical activity (FABQ-PA) scores on test and retest plotted against the average of scores. The center line represents the mean difference with 95% CI (dashed lines), and the solid flanking lines represent the 95% limits of agreement.
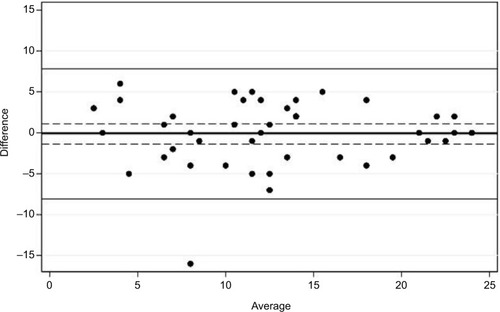
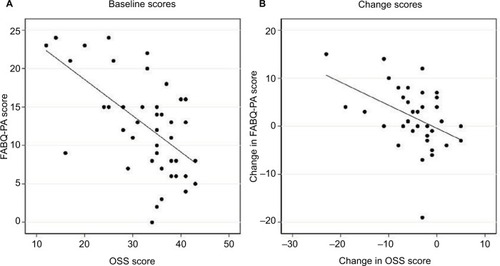
Figure 2 (A) Correlation between FABQ-PA scale and OSS at baseline; (B) correlation between change scores from baseline to 3 months for the FABQ-PA and OSS.
Abbreviations: Fear-Avoidance Belief Questionnaire for physical activity; OSS, Oxford Shoulder Score.