
Figures & data
Figure 1 Response to treatment for (A) the C30-SS from baseline to week 12, (B) the diarrhea burden from baseline to week 12, and (C) the flushing burden from baseline to week 12.
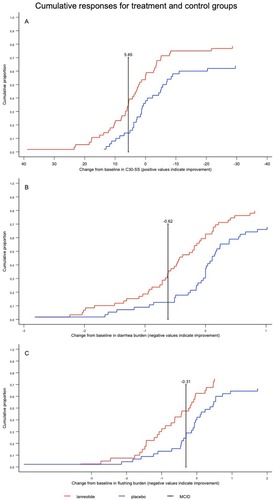
Table 1 Overall Treatment Effect On The NET Function Responses, Classified As Responders Vs Non-Responders
Table 2 Association Of Percentage Of Days With Rescue Medication In The 16-Week Double-Blind Period And NET Function Responses
Availability Of Data And Material
Where patient data can be anonymized, Ipsen will share all individual participant data that underlie the results reported in this article with qualified researchers who provide a valid research question. Study documents, such as the study protocol and clinical study report, are not always available. Proposals should be submitted to [email protected] and will be assessed by a scientific review board. Data are available beginning 6 months and ending 5 years after publication; after this time, only raw data may be available.