Figures & data
Table 1 The 12 items of the Oxford elbow score
Figure 1 Person (n = 146) and item (12 items) or Wright map for the Oxford elbow score scale. Positive scores indicate better quality of life, whereas negative scores indicate poorer quality of life. Items from the scale are shown on the right side of the figure, and person measures are highlighted by “#” or “.”
Abbreviations: M, mean; S, one standard deviation from the mean; T, two standard deviations from the mean.
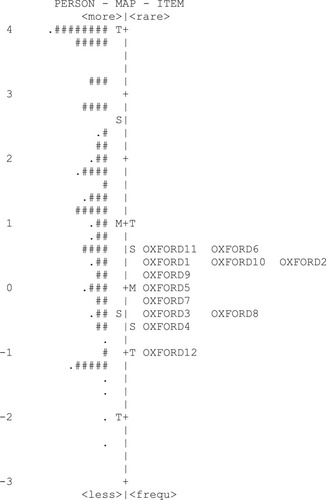
Table 2 Item statistics, Oxford elbow score, Dutch version
Figure 2 Category probability curve of the Dutch version of the Oxford elbow score scale showing the probability of assigning to any particular category (y axis) given the difference in estimates between any patient quality of life measurement and any item difficulty. The threshold estimates correspond to the intersection of rating scale categories.
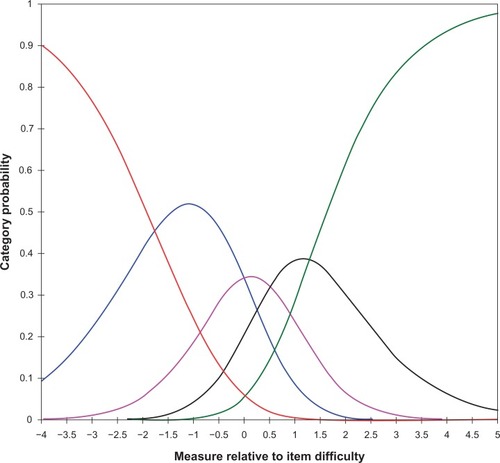
Table 3 Summary of the category structure of the Oxford elbow score, Dutch version