
Figures & data
Table 1 Domains of Andersen Behavior Model and Their Corresponding Variables in USRDS
Table 2 Patient Demographics and Clinical Characteristics by CHD/HHD
Table 3 Patient Demographics and Clinical Characteristics by Racial/Ethnic Groups
Table 4 Odds Ratios and 95% Confidence Intervals of Home Hemodialysis Utilization (vs Center Hemodialysis) in Minority Groups (vs Whites) (from EquationEquation 1(1) )
Figure 1 Unadjusted and adjusted odds ratios and 95% confidence intervals for home hemodialysis utilization (vs center hemodialysis) in minority groups (vs Whites). The adjusted model included demographics such as age, gender, region, dialysis service years, and medical factors such as various comorbidities and chronic conditions.
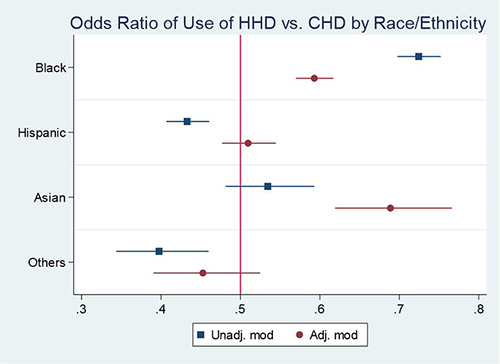
Table 5 Odds Ratios and 95% Confidence Intervals of Risk Factors for Mortality in the Overall Cohort (from EquationEquation 2(2) )
Figure 2 Adjusted odds ratios and 95% confidence intervals for mortality in minority groups (vs Whites). The adjusted model included demographics such as age group, race, gender, region, year of hemodialysis service, treatment (HHD or CHD), medical factors such as various comorbid and chronic conditions, and treatment and age group interaction.
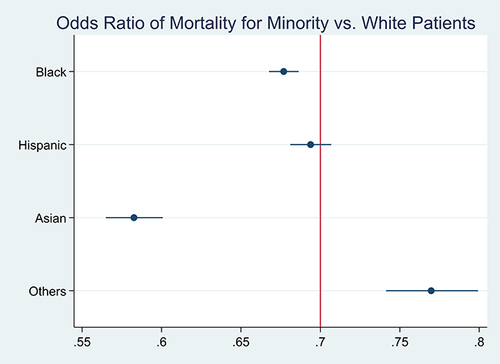
Table 6 Mortality of HHD vs CHD in Overall and Every Racial/Ethnic Cohort
Table 7 Odds Ratios and 95% Confidence Intervals of Risk Factors for Hospitalization in the Overall Cohort (from EquationEquation 3(3) )
Figure 3 Adjusted odds ratios and 95% confidence intervals of whether have been hospitalized in minority groups (vs Whites). The adjusted model included demographics such as age group, race, gender, region, year of hemodialysis service, treatment (HHD or CHD), medical factors such as various comorbid and chronic conditions, and treatment and age group interaction.
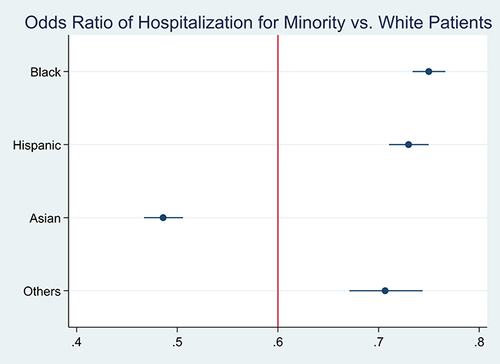
Table 8 Hospitalization of HHD vs CHD in Overall and Every Racial/Ethnic Cohort