
Figures & data
Table 1 Western Ontario Osteoarthritis of the Shoulder index
Figure 1 Scree plot.
Notes: The scree plot shows the results of the PCA for the pooled osteoarthritis and fracture data. It illustrates the distribution of eigenvalues among the 19 contrasts.
Abbreviation: PCA, principal component analysis.
Abbreviation: PCA, principal component analysis.
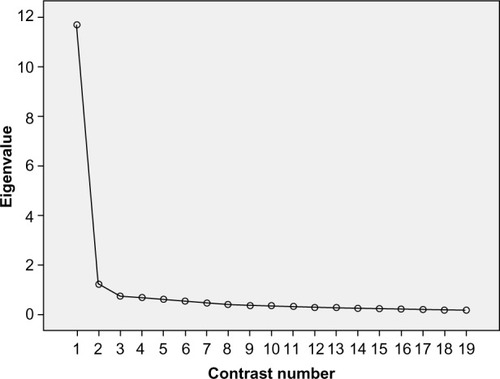
Figure 2 Histograms of item scores.
Notes: The histograms of each item on WOOS depict the distribution of the item scores in the common study population. The counts indicate the number of responses.
Abbreviation: WOOS, Western Ontario Osteoarthritis of the Shoulder.
Abbreviation: WOOS, Western Ontario Osteoarthritis of the Shoulder.
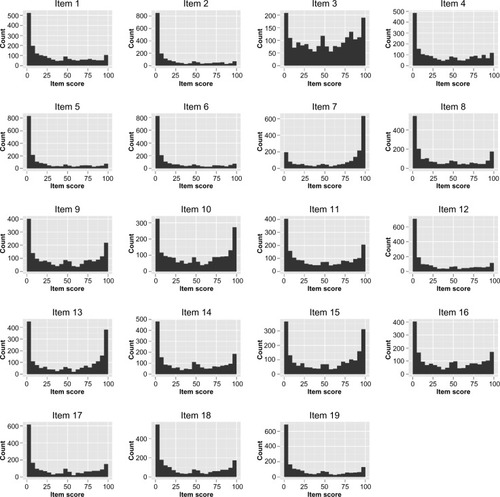
Table 2 Summary of the category structure of the Danish version of WOOS
Figure 3 Wright map of the WOOS scale for osteoarthritis patients.
Notes: People (n=847) are shown on the left side, and the 19 items are shown on the right side. Each “#” represents 23 patients, and each “.” represents 1–22 patients. The logit scale represents quality of life. Positive scores indicate bad outcomes, and negative scores indicate good outcomes. The mean item difficulty was defined as zero on the scale.
Abbreviation: WOOS, Western Ontario Osteoarthritis of the Shoulder; M, mean; S, one standard deviation; T, two standard deviations.
Abbreviation: WOOS, Western Ontario Osteoarthritis of the Shoulder; M, mean; S, one standard deviation; T, two standard deviations.
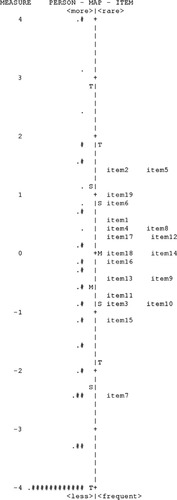
Table 3 Item statistics for the WOOS for osteoarthritis patients
Table 4 Item statistics for the WOOS for fracture patients
Figure 4 Differential item functioning plot.
Note: These graphs show the item difficulty measures for FR and OA.
Abbreviations: DIF, differential item functioning; FR, fracture; OA, osteoarthritis.
Abbreviations: DIF, differential item functioning; FR, fracture; OA, osteoarthritis.
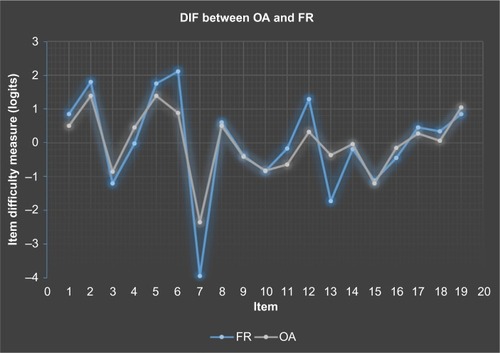
Table 5 Significant DIF between fracture patients and osteoarthtitis patients