
Figures & data
Table 1 Characteristics of the NARCOMS and DER-401 cohorts
Table 2 Precision of the NARCOMS ordinary least squares mapping equation applied to data from study DER-401Table Footnotea
Table 3 Percentage of predicted EQ-5D-3L values within ranges of absolute error of observed value in DER-401 relative to data from the original validation study
Figure 1 Scatterplot of observed versus predicted EQ-5D-3L scores for the DER-401 cohort at baseline.
Abbreviations: DER, dalfampridine extended release; EQ-5D-3L, EuroQol 5-dimension 3-level version.
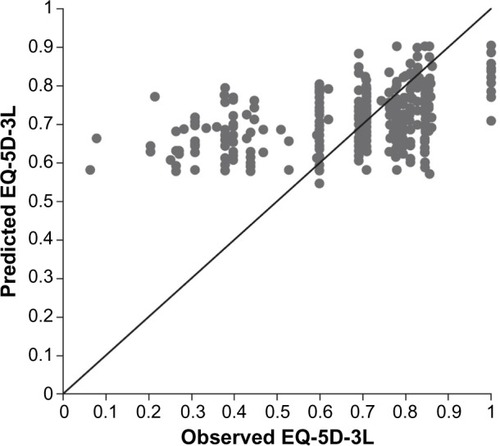
Figure 2 Scatterplot of observed versus predicted EQ-5D-3L scores for the DER-401 cohort at week 4.
Abbreviations: DER, dalfampridine extended release; EQ-5D-3L, EuroQol 5-dimension 3-level version.
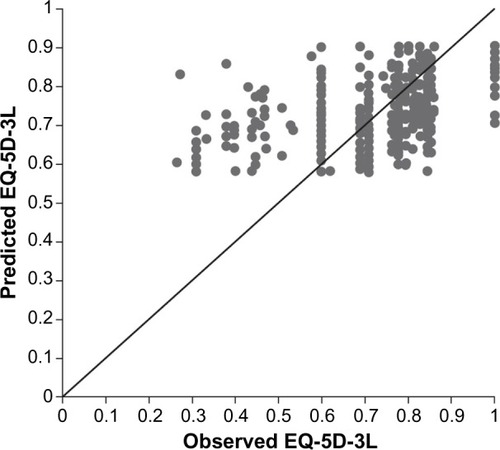
Table S1 The 12-item Multiple Sclerosis Walking Scale (MSWS-12)
• These questions ask about limitations to your walking due to MS during the past 2 weeks.
• For each statement, please circle the one number that best describes your degree of limitation.
• Please answer all questions even if some seem rather similar to others, or seem irrelevant to you.
• If you cannot walk at all, please tick this box.□