157
Views
1
CrossRef citations to date
0
Altmetric
Original Research

Frequency of Health Care Resource Utilization and Direct Medical Costs Associated with Psoriatic Arthritis in a Rheumatic Care Center in Colombia

ORCID Icon, ORCID Icon, ORCID Icon, ORCID Icon, , ORCID Icon, ORCID Icon & ORCID Icon show all
Pages 31-39 | Published online: 18 Mar 2021

Figures & data

Table 1 Baseline Sociodemographic Characteristics of the Study Sample

Table 2 Frequency of Health Care Services and Medication Utilization

Table 3 Distribution of Patients According to the Type of Pharmacological Therapy Received

Table 4 Unadjusted Annual Mean and Median PsA-Related Medical Costs

Figure 1 Comparison of the annual average medical direct cost of PsA by sex, age groups and type of DMARD. (A) Average cost by sex. (B) Average cost by age range. (C) Average cost by type of DMARD.

Notes: (A) Ratio male:female = 1.3. (B) Ratio <60 years old:60 years and over = 1.4. (C) Ratio bDMARDs:cDMARDs = 7.9.

Figure 1 Comparison of the annual average medical direct cost of PsA by sex, age groups and type of DMARD. (A) Average cost by sex. (B) Average cost by age range. (C) Average cost by type of DMARD.Notes: (A) Ratio male:female = 1.3. (B) Ratio <60 years old:60 years and over = 1.4. (C) Ratio bDMARDs:cDMARDs = 7.9.

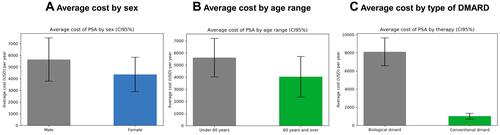
Table 5 Comparison of Direct Medical Costs According to the Type of Disease Modifying Anti-Rheumatic Drugs Received, Sex and Age Group

Figure 2 Cost per patient with PsA by sex and age groups and its statistical differences. (A) Boxplot by sex. (B) Boxplot by age groups.

Notes: Prepared by the authors from their data base. (A) No statistical differences in costs by sex. Mann–Whitney: U = 735, P = 0.13. (B) Statistical differences in costs by age groups. Mann–Whitney: U = 649, P = 0.03.
Figure 2 Cost per patient with PsA by sex and age groups and its statistical differences. (A) Boxplot by sex. (B) Boxplot by age groups.

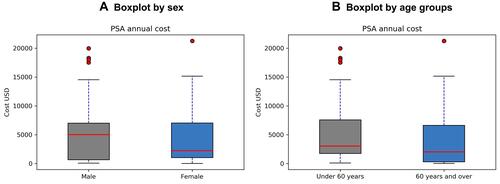
Table 6 Multivariate Regression Analysis of Direct Medical Costs