
Figures & data
Table 1 Baseline Patients’ Characteristics (N=68)
Table 2 Reasons for Switching Biologics from Previous Biologics
Figure 1 Mean PASI scores (± SD) at different time points for all patients and patients stratified by prior biologic use. *All Ps=0.000 versus Week 0 for all groups, respectively.
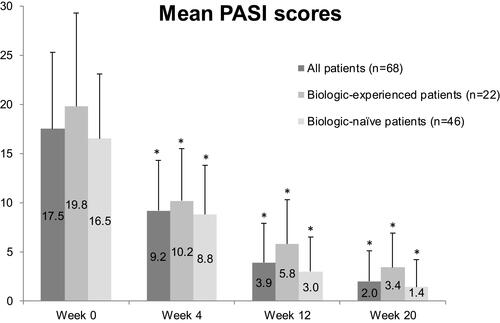
Table 3 Subgroup Analysis for PASI Response at Week 4, Week 12 and Week 20