Figures & data
Figure 1 Continue.
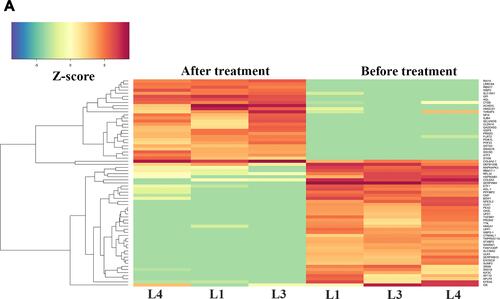
Figure 1 (A) Heatmap visualization of z-scores for DEGs identified in samples before and after intervention. (B) Volcano plot of RNA-Seq data. The Volcano plot can show differential RNA expression between the two groups (expression of after phototherapy versus before phototherapy). The horizontal line represents a P-value of 0.05 (log10 scaled). The red dots represent significant differentially-expressed genes, and the black dots represent gene expression that was not significantly different.
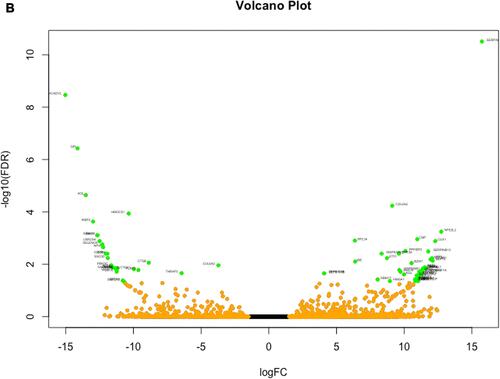
Table 1 Baseline Characteristics of Patients with Psoriasis
Table 2 Significant Down-Regulated Genes Involved with Major Pathogenesis of Psoriasis are Affected by NB-UVB Phototherapy in Psoriasis Lesion Using DAVID Bioinformatics Resources
Figure 2 Functional enrichment and annotation for DEGs analyzed using Metascape with major sources, including GO Biological Processes, Reactome Gene Sets and WikiPathways.
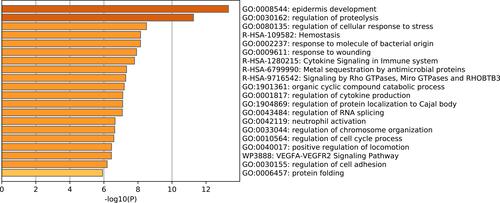
Figure 3 Continue.
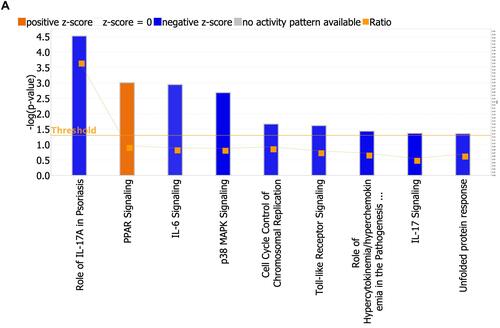
Figure 3 (A) Pathway analysis. Enrichment of top clusters for significant DEGs was analyzed with −log (FDR) = 1.3 and an absolute value of z-score > 2. The height of the bars represents the probability that the DEGs in the dataset are related to each pathway. The Orange bars show predicted pathway activation, and the blue bars show predicted pathway inhibition. The Orange points connected by a line represent the ratio which presents the proportion of DEGs in the datasets that map to each canonical pathway. (B) Pathway analysis with the percentage of upregulated DEGs (red segment of bar), the percentage of downregulated DEGs (green segment of bar) and overlaps in each pathway. Percentage of non-overlapped DEGs to the pathways is shown by the white segment of the bar. The number of molecules in each known pathway are shown on the top of the bar.
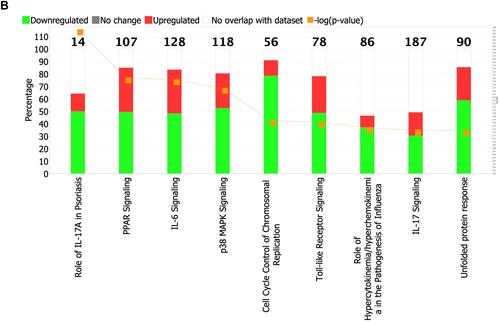
Table 3 Effect of NB-UVB Phototherapy on Major Pathways in Psoriasis
Table 4 Top 20 Upstream Regulators Were Predicted to Be Inhibited by z-Score
Table 5 Top 20 Upstream Regulators Were Predicted to Be Activated by Z-Score
Table 6 Top Upstream Regulators Associated with a Molecule of Cytokine by Z-Score
Table 7 Top Upstream Regulators Associated with a Transmembrane Receptor by Z-Score
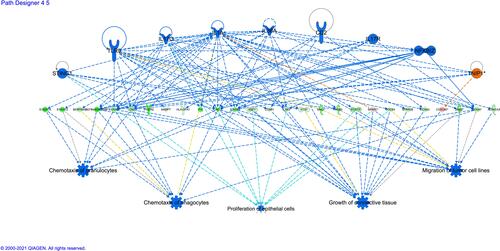
Figure 4 Regulatory effects analysis. The Regulatory effects network was generated by connections between predicted upstream regulators and DEGs and predicted downstream functions or diseases.