
Figures & data
Table 1 Demographic and Clinical Baseline Characteristics of the PSO Patients Included Across 2017–2020. Continuous Variables are Reported as the Mean ± SD, Categorical Variables as Numbers and Percentages in Brackets
Figure 1 Treatment patterns at baseline in PSO patients included across 2017–2020. In patients included across 2017–2020, during the first year of follow-up (index-date included), the proportion of patients untreated with systemic medications, treated with conventional therapies/NSAIDs or with biologic/targeted synthetic drugs, was estimated. *Sub-analysis (on databases with a complete recording of 2020, included patients N = 120,363). Percentages are calculated on included PSO patients.
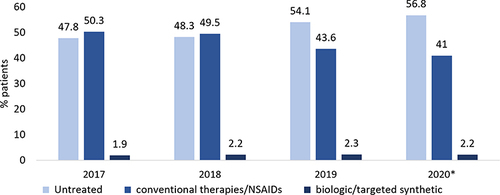
Table 2 Stratification of PSO Patients Based on the Type of b/tsDMARD Prescribed at Inclusion. Data are Given as Numbers and Percentages in Brackets
Figure 2 Treatment patterns of biologic/synthetic therapies in PSO patients at the inclusion. The percentage of overall (A), bioexperienced (B), and bionaïve (C) PSO patients included across 2017–2020 under different biologic drug class was reported. *Sub-analysis (on databases with a complete recording of 2020, included patients N = 120,363); N (Number of patients). The total number of biologic-treated patients for each calendar year is reported; the percentages are calculated on biologic-treated patients.
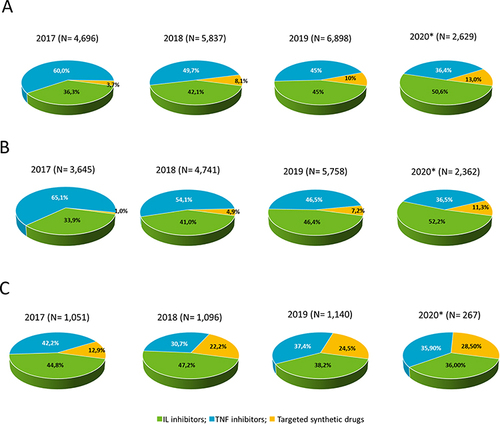
Table 3 Treatment Persistence During the First Year of Follow-Up in Bionaïve PSO Patients Included During 2015 and 2018. Persistent Patients are Reported as Numbers and Percentages in Brackets
Table 4 Monthly Maintenance Dosages and Durations Between Prescriptions During the First Year of Follow-Up in Bionaïve PSO Patients Included During 2015 and 2018. Data on Maintenance Dose (Mg) and Duration Between Prescriptions (Weeks) are Given as the Mean ± SD