
Figures & data
Figure 1 Conceptual framework.
Abbreviation: CHI, Community Health Insurance.
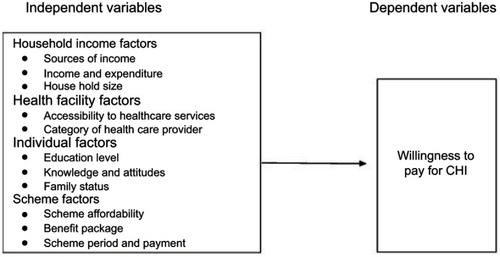
Table 1 Social demographic characteristics of respondents (N=312)
Table 2 The WTP for community health insurance and income quintiles
Table 3 Respondent’s household monthly and annual average expenditure on basic needs in UGX
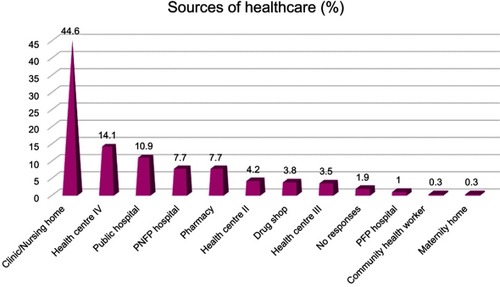
Figure 2 Households health care sources.
Abbreviation: WTP, willingness to pay.
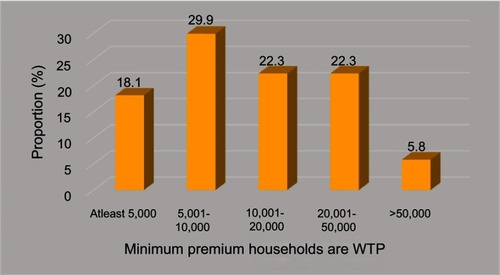
Table 4 Relationship between level of education and WTP for CHI
Table 5 Regression analysis for WTP
Table 6 Source of information about health insurance
Figure 3 Minimum premium households are WTP monthly.
Abbreviations: WTP, willingness to pay; PFP, private for profit.
Availability of data and materials
The data are available and can be provided on request.