
Figures & data
Table 1 Demographic data
Figure 1 Health insurance status of Thai and migrant children.
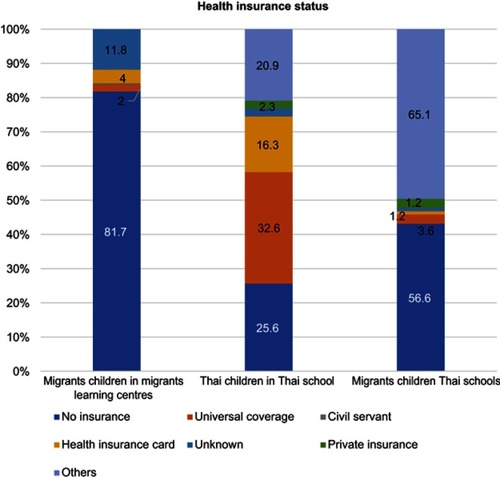
Figure 2 Birth countries and locations for Thai and migrant children.
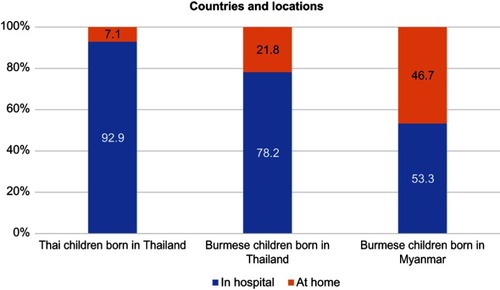
Figure 3 Physical status descriptive analyses for height for age, weight for age, and weight for height. Height for age: 1 - short, 2 - slightly short, 3 - normal, 4 - slightly tall, 5 - tall. Weight for age: 1 - underweight, 2 - slightly underweight, 3 - normal, 4 - slightly overweight, 5 - overweight. Weight for height: 1 - thin, 2 - slightly thin, 3 - normal, 4 - possible risk of overweight, 5 - overweight, 6 - obese.
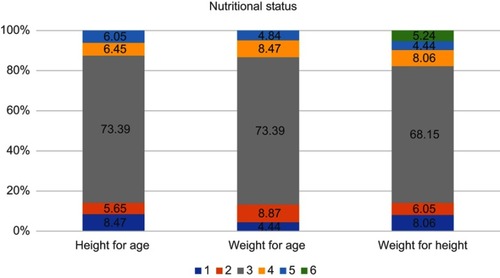
Table 2 Physicall status logistic regression analysis
Figure 4 Hygiene behaviors descriptive analysis.
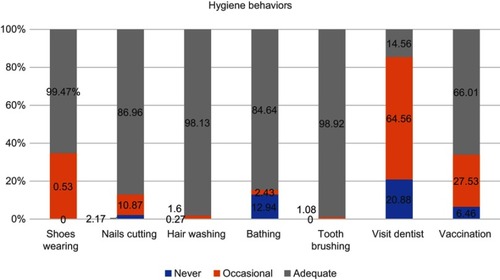
Table 3 Hygiene behaviors logistic regression analysis