
Figures & data
Figure 1 Flow of the forecasting model.
Abbreviations: ACF, autocorrelation function; PACF, partial autocorrelation function; AIC, Akaike’s information criterion.
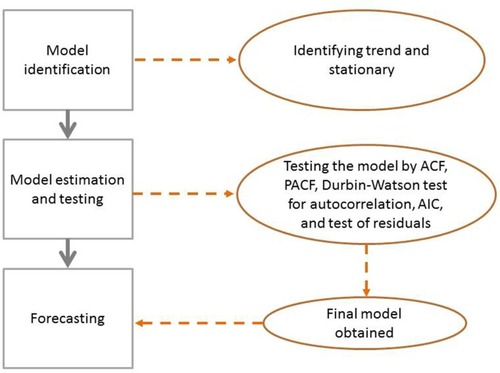
Figure 2 Historical plots of patients by RRT modality over time: (A) dialysis; (B) kidney transplant.
Abbreviations: CAPD, continuous ambulatory peritoneal dialysis; HD, hemodialysis; KT, kidney transplant.
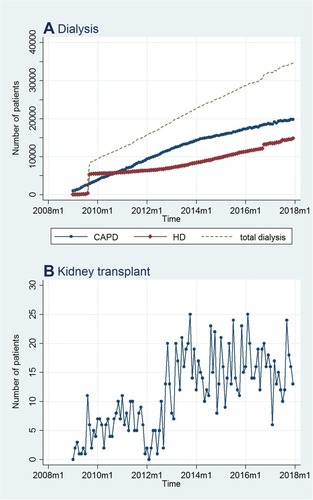
Figure 3 Autocorrelation and partial autocorrelation plots of CAPD (A–D), HD (E–H) and KT (I–L).
Note: Shaded areas represent 95% confidence bands.
Abbreviations: pd, continuous automated peritoneal dialysis; Dpd, differenced series of continuous automated peritoneal dialysis; hd, hemodialysis; Dhd, differenced series of hemodialysis; kt, kidney transplant; Dkt, differenced series of kidney transplant.
Abbreviations: pd, continuous automated peritoneal dialysis; Dpd, differenced series of continuous automated peritoneal dialysis; hd, hemodialysis; Dhd, differenced series of hemodialysis; kt, kidney transplant; Dkt, differenced series of kidney transplant.
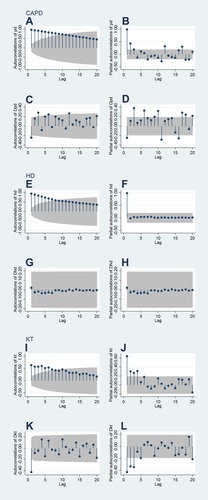
Figure 4 Actual and predicted number of CAPD (A) and HD (B) patients.
Abbreviations: RRT, renal replacement therapy; CAPD, continuous ambulatory peritoneal dialysis; HD, hemodialysis.
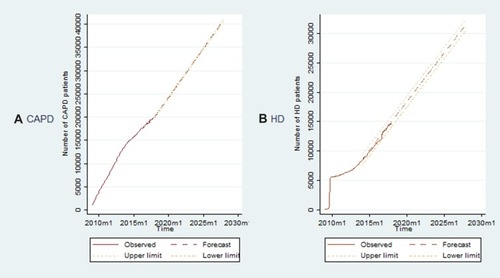
Figure 5 Actual and predicted number of KT patients.
Abbreviations: RRT, renal replacement therapy; KT, kidney transplant.
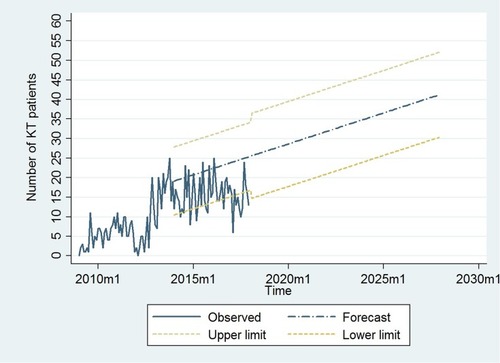
Table 1 Forecasted Total Number of Patients by RRT Modality from 2018 to 2027 and the Percentage Growth Rates (in Parenthesis)