
Figures & data
Table 1 Socio-Demographic And Clinical Characteristics Of The Study Participants At Hiwot Fana Specialized University Hospital, Eastern Ethiopia, January 2015–April 2019
Figure 1 Trend of TB and rifampicin resistance at Hiwot Fana Specialized University Hospital, Eastern Ethiopia, January 2015–April 2019.
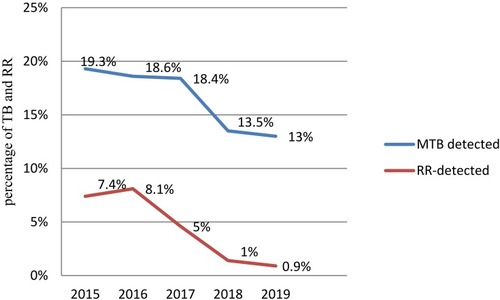
Table 2 Trend Of Tuberculosis By Different Characteristics Of The Study Participants At Hiwot Fana Specialized University Hospital, Eastern Ethiopia, January 2015–April 2019
Table 3 Trend Of Tuberculosis By Month, Season, And Year at Hiwot Fana Specialized University Hospital, Eastern Ethiopia, January 2015–April 2019
Figure 2 Graphical presentation of TB and rifampicin resistance at Hiwot Fana Specialized University Hospital, Eastern Ethiopia, January 2015–April 2019.
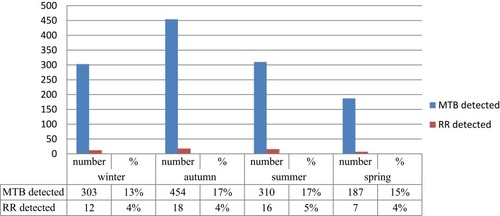
Table 4 Factor Associated With Tuberculosis By Sex, Age, Status Of HIV, History Of TB, And Residence Of Study Participants At Hiwot Fana Specialized University Hospital, Eastern Ethiopia, January 2015–April 2019
Availability Of Data And Materials
The raw data set used/analyzed during the current study is available from the author on reasonable request.