
Figures & data
Table 1 Numbers (Percentages in Parentheses) of Subjects by Delivery Mode and Other Characteristics in Full Sample and in Jiangsu and Inner Mongolia
Figure 1 Scatterplots of monthly caesarean section rates in Jiangsu and Inner Mongolia between 2012 and 2016 by month. Solid curves are segmented locally estimated scatterplot smoothing (LOESS) curves; dashed vertical lines denote the time points at which the partial and universal two-child policies were launched.
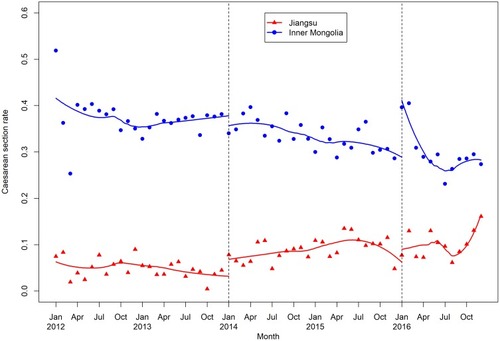
Table 2 Estimates of the Coefficients (95% Confidence Intervals) in Segmented Logistic Regression Models on Caesarean Section Rate with and Without Covariate Adjustment for Jiangsu and Inner Mongolia, Respectively, for Detecting Changes Following the Launch of China’s Two-Child Policies
Table 3 Differences in the Initial Phase and in Level and Trend Changes in Log Odds of Caesarean Section (95% Confidence Intervals) Between Inner Mongolia (Reference) and Jiangsu with and Without Covariate Adjustment
Table 4 Odds Ratios of Caesarean Section (95% Confidence Intervals) Given by Other Covariates in Jiangsu and Inner Mongolia and in Their Comparison