
Figures & data
Figure 1 The scale of disability in the elderly over 65 in China from 2003–2016(unit:10,000).
Note: Drew based on the data from “China population yearbook”.
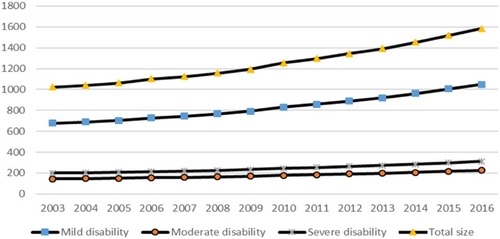
Table 1 Descriptive Univariate Information in the 2015 CHARLS Data
Table 2 Availability of LTC Services by Health Insurance (Weighted Percentages)
Table 3 Multivariate Analysis of Factors Associated with the Availability of Long-Term Care Services
Table 4 Sub-Multivariate Analysis of Factors Associated with the Availability of Long-Term Care Services by the Differences Between Urban and Rural Areas