
Figures & data
Table 1 Unadjusted ORs and 95%CIs for Total LUTS, IRR and OBS Symptoms by the Drinking Years
Table 2 Age- and Multivariate-Adjusted ORs and 95%CIs for Total LUTS, IRR and OBS Symptoms by the Drinking Years
Figure 1 The prevalence of moderate or severe LUTS increases apparently with age growth.
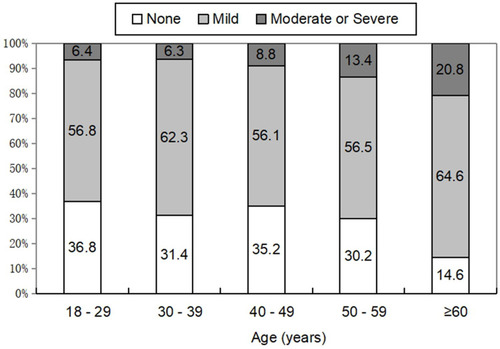
Table 3 Characteristics of the Study Population Stratified by the Severity of LUTS
Table 4 ORs and 95%CIs for Total LUTS, Irritative and Obstructive Symptoms Score by the Drinking Frequency