
Figures & data
Figure 1 Workflow in this study. Patients being treated were defined as patients with an antiviral drug therapy during the course of study.
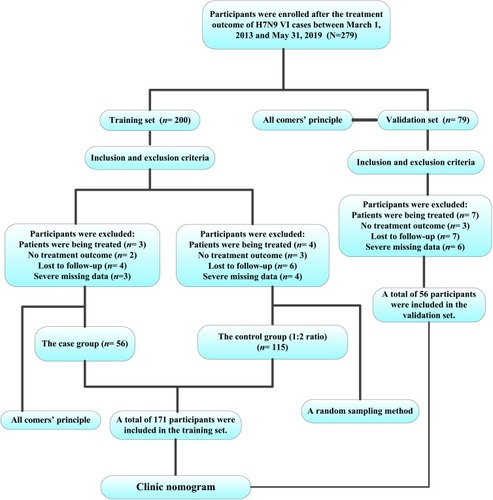
Table 1 Definitions of This Study
Table 2 Baseline Characteristics of Patients with H7N9 Virus Infection in the Study Population
Table 3 Univariable Cox Proportional Hazard Regression Analysis of Predictors for the Survival with Influenza A (H7N9) in Zhejiang Province, China
Figure 2 The nomogram for individualized predicting the 1-, 2-, and 3-month probabilities of survival from influenza A (H7N9).
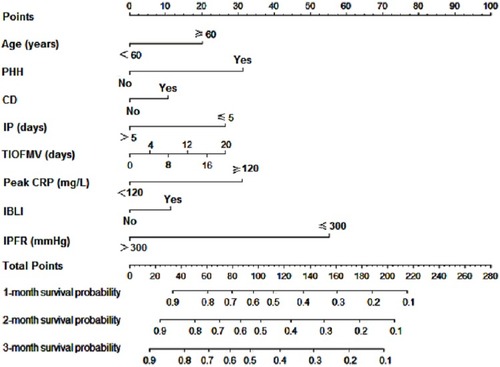
Table 4 Multivariable Cox Proportional Hazard Regression Model for the Survival on Patients with H7N9 Virus Infection in Zhejiang Province, China
Figure 3 The calibration curves for predicting the probability of survival from influenza A (H7N9) at each time point in the training set. Nomogram predicted the 1-, 2- and 3-month probabilities of survival from influenza A (H7N9) which are plotted on the X-axis and observed the 1-, 2- and 3-month probabilities of survival from influenza A (H7N9) which are plotted on the Y-axis.
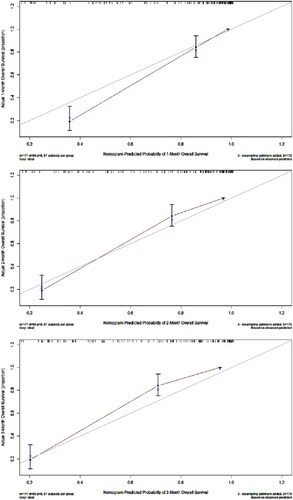
Figure 4 The calibration curves for predicting the probability of survival from influenza A (H7N9) at each time point in the external validation set. Nomogram predicted the 1-, 2- and 3-month probabilities of survival from influenza A (H7N9) which are plotted on the X-axis and observed the 1-, 2- and 3-month probabilities of survival from influenza A (H7N9) which are plotted on the Y-axis.
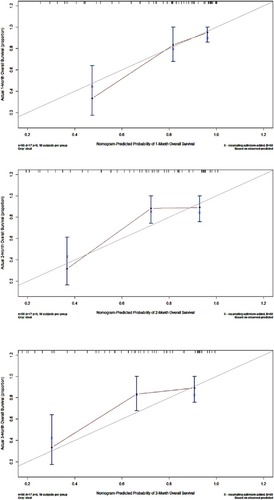
Table 5 Predicting an Individual H7N9 Patient’s Survival