
Figures & data
Figure 1 Flow chart of the study sample.
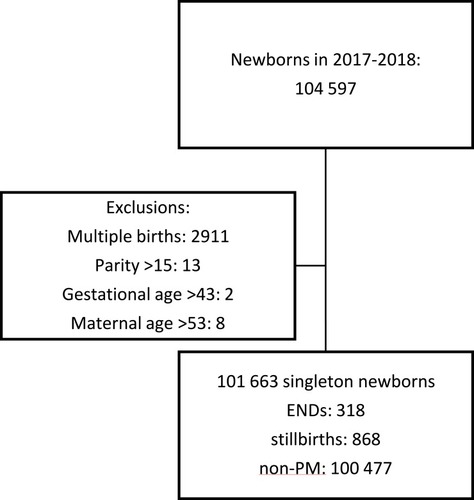
Figure 2 Directed acyclic graph presenting causal associations between perinatal mortality (PM), antenatal care (ANC) attendance, and potential confounders. GA: gestational age.
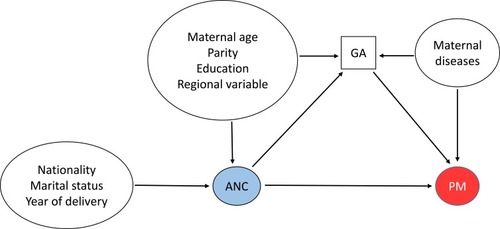
Figure 3 Perinatal mortality (PM) rate by gestational age (GA) and ANC attendance (attended pregnancies: at least one ANC visit during pregnancy; unattended pregnancies: no ANC visits during pregnancy) among singletons.
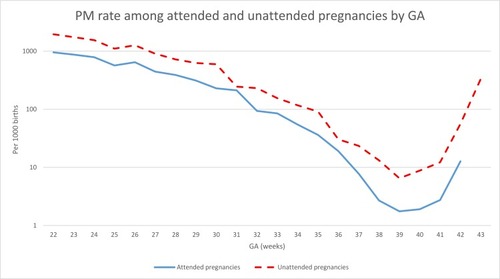
Table 1 Incidence of Early Neonatal Death (END), Stillbirth (SB), and Perinatal Mortality (PM) by Antenatal Care Attendance (Attended and Unattended Pregnanciesa).
Table 2 Maternal and Neonatal Characteristics by Singleton Perinatal Mortality (PM) Cases.
Figure 4 Map of Georgia – maternal residential regions by antenatal care attendance rates.

Table 3 Maternal and Neonatal Characteristics by ANC Attendance (Attended and Unattended Pregnanciesa).
Table 4 Odds Ratios and 95% Confidence Intervals for the Association Between Antenatal Care (ANC) Attendance (Attended and Unattended Pregnanciesa), Maternal Characteristics, and PM.