
Figures & data
Figure 1 Flow chart of participant included and excluded in cross-sectional analysis.
Abbreviations: UA, uric acid; TG, triglycerides; TC, total cholesterol.
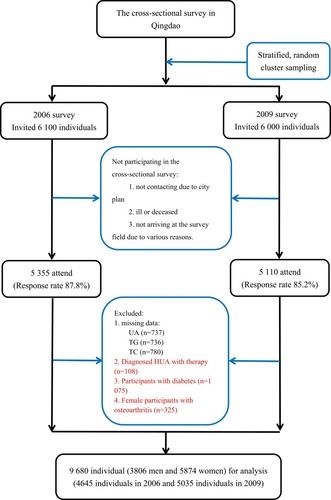
Table 1 Baseline Characteristics of the Participants
Table 2 Odds Ratio (95% Confidence Interval) for HUA in Association to Triglycerides and Total Cholesterol Concentration by Univariate Logistic Regression
Table 3 OR (95% CI) for HUA in Association to TG and TC Concentration by Multivariable Logistic Regression
Table 4 OR (95% CI) for HUA in Association to TG and TC Concentration by Stratified Analysis of Age