Figures & data
Table 1 Socio-Demographic Characteristics of Study Participants, JKU, South Omo Area, 2019
Table 2 Frequency Distribution of Participants’ Knowledge About the Cause and Signs/Symptoms of YF
Table 3 Frequency Distribution of Participants’ Knowledge About Mode of Transmission and Prevention of YF
Table 4 Frequency Distribution of Participants’ Attitude Toward YF
Table 5 Frequency Distribution of Participants YF Related Risky Practices
Table 7 Bivariate and Multivariable Logistic Regression Analyses Showing Factors Associated with Overall Attitude of Study Participants About YF
Figure 1 Rate of high overall knowledge score by year of enrollment and among all participants.
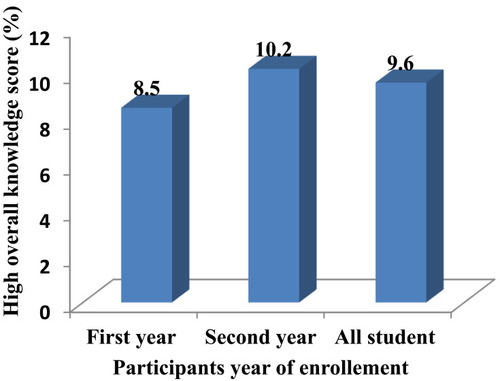
Table 6 Bivariate and Multivariable Logistic Regression Analyses Showing Factors Associated with Overall Knowledge of Study Participants About YF
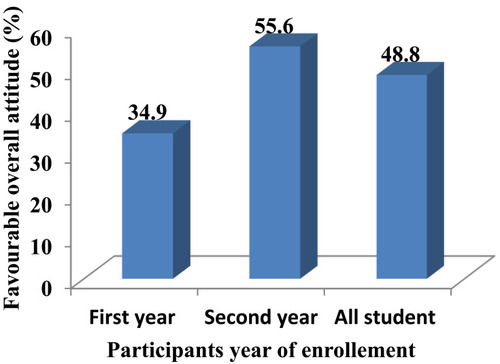
Figure 2 Rate of favorable overall attitude score by year of enrollment and among all participants.