
Figures & data
Figure 1 The flow chart shows the whole process of data collection, processing and analysis in this study.
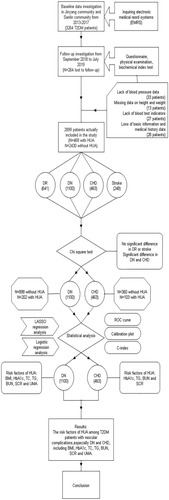
Table 1 Demographic and Clinical Characteristics of the Participants in the HUA and NHUA Groups
Table 2 Comparison of the Morbidity of Four Complications (CHD, Stroke, DR and DN) Between the Two Groups
Figure 2 Demographic and clinical feature selection using the LASSO binary logistic regression model in T2DM patients with CHD. (A) Optimal parameter (lambda) selection in the LASSO model used fivefold cross-validation based on minimum criteria. The partial likelihood deviance (binomial deviance) curve was plotted versus log(lambda). Dotted vertical lines were drawn at the optimal values by using the minimum criteria and the 1 SE of the minimum criteria (the 1-SE criteria). LASSO coefficient profiles of the 4 features. (B) A coefficient profile plot was produced against the log(lambda) sequence. A vertical line was drawn at the value selected using fivefold cross-validation, where optimal lambda resulted in 4features with nonzero coefficients.
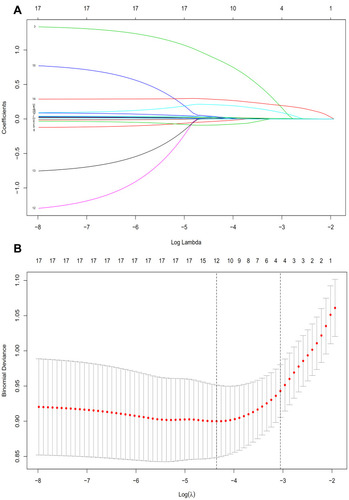
Figure 3 Demographic and clinical feature selection using the LASSO binary logistic regression model in T2DM patients with DN. (A) Optimal parameter (lambda) selection in the LASSO model used fivefold cross-validation based on minimum criteria. The partial likelihood deviance (binomial deviance) curve was plotted versus log(lambda). Dotted vertical lines were drawn at the optimal values by using the minimum criteria and the 1 SE of the minimum criteria (the 1-SE criteria). LASSO coefficient profiles of the 7 features. (B) A coefficient profile plot was produced against the log(lambda) sequence. A vertical line was drawn at the value selected using fivefold cross-validation, where optimal lambda resulted in 7 features with nonzero coefficients.
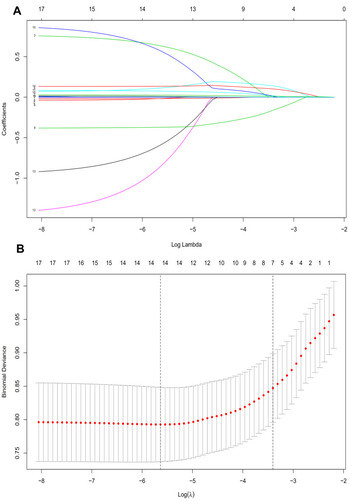
Figure 4 Forest plot of the OR of the selected feature. Use of forest plot for outcome of logistic regression analysis. In the plane rectangular coordinate system, the forest plot takes a vertical invalid line (scale of abscissa is 1) as the center, describes the effect quantity and confidence interval of each study by using multiple line segments parallel to the horizontal axis, and describes the effect quantity and confidence interval of multiple studies by using a rectangle. (A) T2DM patients with CHD: The horizontal lines corresponding to 95% CI of HbA1c, TG, BUN and SCR do not intersect the centerline. 95% CI of HbA1c falls to the left of the centerline, indicating HbA1c was the protective factor of HUA in T2DM patients with CHD. Other factors were the risk factors of HUA. (B) T2DM patients with DN: The horizontal lines corresponding to 95% CI of BMI, HbA1c, TC, TG, BUN, SCR and UMA do not intersect the centerline. 95% CI of HbA1c falls to the left of the centerline, indicating HbA1c was the protective factor of HUA in T2DM patients with DN. Other factors were the risk factors of HUA.
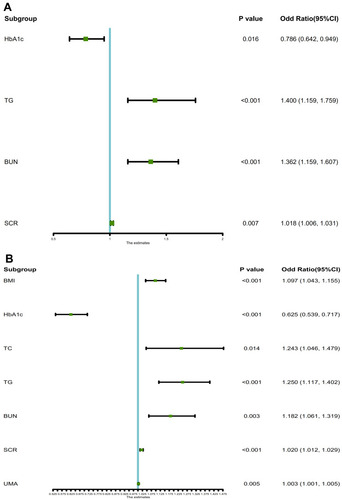
Table 3 Coefficients and Lambda.1se Values of LASSO in CHD and DN
Table 4 Logistic Regression Analysis Based on CHD
Table 5 Logistic Regression Analysis Based on DN
Figure 5 The pooled AUC of the ROC curve. (A) T2DM patients with CHD & (B) T2DM patients with DN: The y-axis indicates the true positive rate of the risk prediction. The x-axis indicates the false positive rate of the risk prediction. The blue line represents the performance of the nomogram.
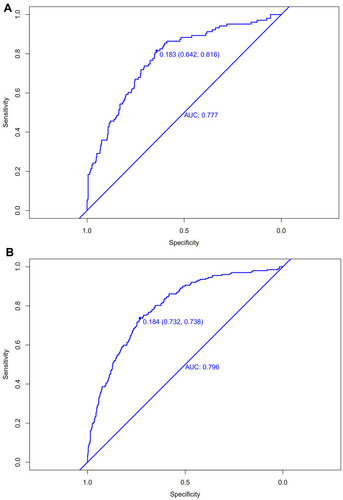
Figure 6 Calibration curves of the HUA incidence risk prediction in the array. (A) T2DM patients with CHD & (B) T2DM patients with DN: The x-axis represents the predicted incidence risk. The y-axis represents the actual diagnosedHUA. The diagonal dotted line represents a perfect prediction by an ideal model. The solid line represents the performance of the nomogram; a closer fit to the diagonal dotted line represents a better prediction.
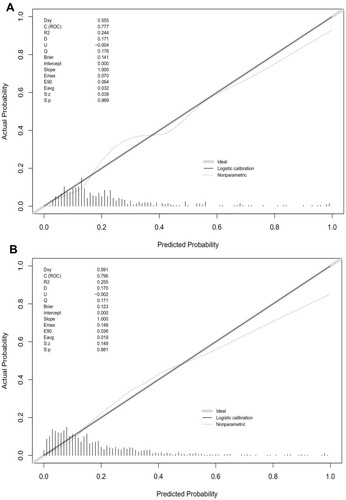
Table 6 C-Index in the Array