Figures & data
Figure 1 Global Covid-19 point prevalence (top) and incidence per million population (bottom). Data current as of March 17, 2020.
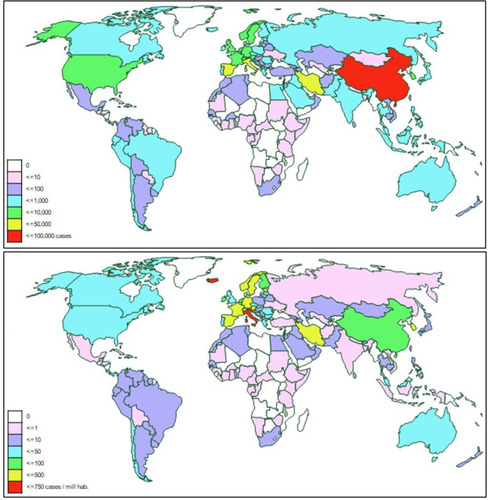
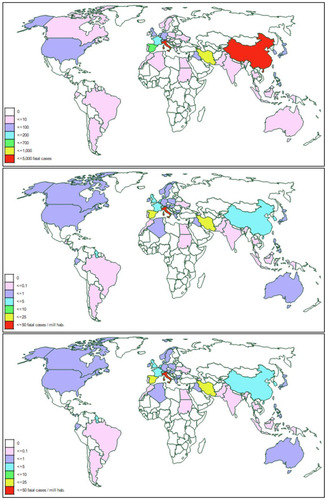
Figure 2 Global Covid-19 fatality point prevalence (top), incidence per million population (middle), and case fatality rate (bottom). Countries with less than 20 confirmed Covid-19 cases were excluded from the case fatality rate analysis due to poor estimate precision. Data current as of March 17, 2020.