
Figures & data
Figure 1 Schematic of X-ray beams in (A) anteroposterior cervical spine and (B) lateral cervical spine.
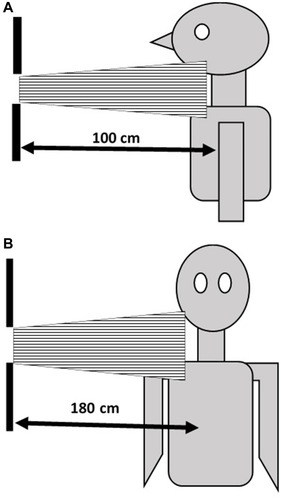
Figure 2 Piranha radiation dosimeter in (A) Piranha internal detector and (B) the Piranha external detector.
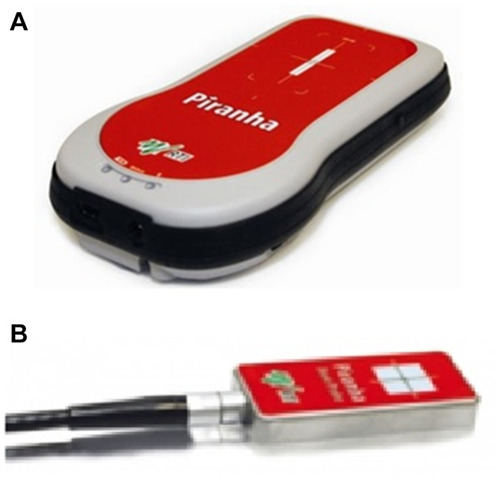
Figure 3 The anthropometric phantom shows the illustration of the external detector position to measure the absorbed dose in (A) without shielding and (B) with shielding.
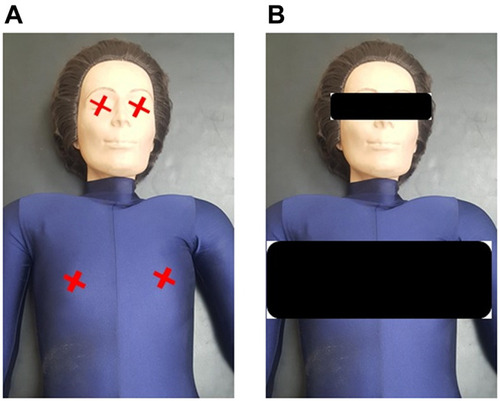
Table 1 Radiation Dose in µGy to Radiosensitive Organs During AP Cervical Spine Radiography
Table 2 Radiation Dose in µGy to Radiosensitive Organs During Lateral Cervical Spine Radiography
Table 3 Results of t-Tests