
Figures & data
Figure 1 Flowchart of the study.
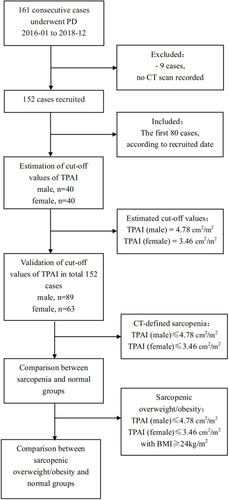
Figure 2 Computed tomographic images at the the middle third lumbar vertebral level. (A) Sagittal map. (B) Cross-sectional image and red circle shows the outline of psoas.
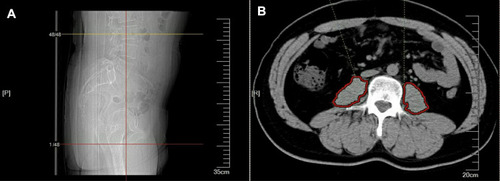
Table 1 Demographic and Clinical Data
Figure 3 Receiver operating characteristic curves of TPAI for major complications. (A) For males. (B) For females.
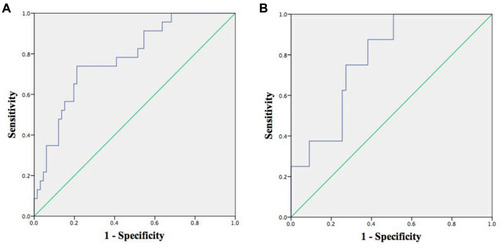
Table 2 Estimation of the Cutoff Values of TPAI
Table 3 Comparison of Outcomes in Different Sarcopenic Cohorts
Table 4 Association Between Different Covariates and Rate of Major Complications