
Figures & data
Figure 1 Exposure to symptom onset timeline for Wuhan-imported (upper panel) or locally infected (lower panel) COVID-19 cases sorted by earliest exposure date.
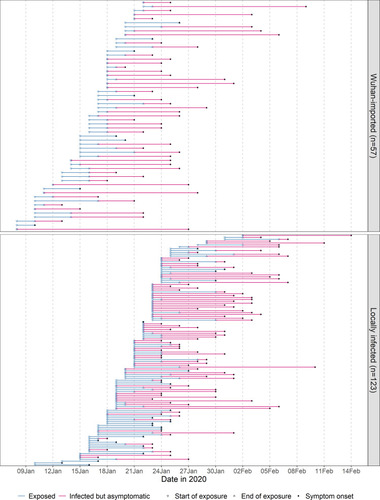
Table 1 Estimated Incubation Period for COVID-19 Cases Using Different Parametric Models
Table 2 Parameter Estimates and 95% Confidence Intervals of Weibull Distributions Used to Estimate the Incubation Period for COVID-19 Cases
Figure 2 Probability density function (left panel) and cumulative distribution function (right panel) of the Weibull distribution used to estimate the distribution of incubation periods by age group for 180 COVID-19 cases in Hubei, China.
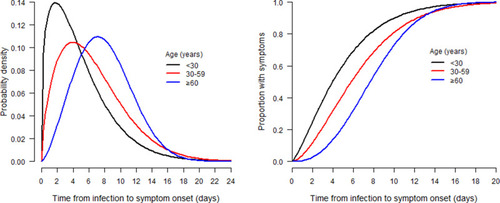
Table 3 Association Between Incubation Periods and Characteristics of COVID-19 Cases in Multivariate Weibull Regression Model