
Figures & data
Table 1 Demographic Information of the Study Participants (N=25)
Table 2 Types of Sports for Physical Activity Used to Perform by the Study Participants (N=25)
Table 3 Time Spent on Sports and Physical Activity by the Study Participants (N=25)
Table 4 Categorization of the Role of National Fitness Plan in the Promotion of Physical Activity and Health Well-Being (N=25)
Table 5 Frequency of Each Type of the Role of National Fitness Plan in the Promotion of Physical Activity and Health Well-Being (N=25)
Table 6 Frequency of Each Type of the Role of National Fitness Plan in the Promotion of Physical Activity and Health Well-Being Gender-Wise (N=25)
Figure 1 Types of sports and physical activity.
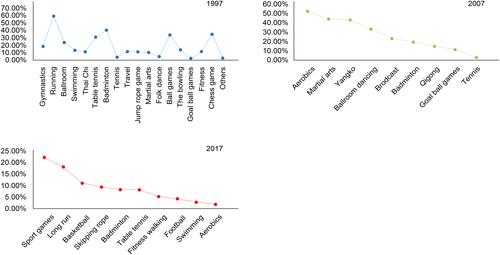
Figure 2 Trend of sports and physical activity with main purpose.
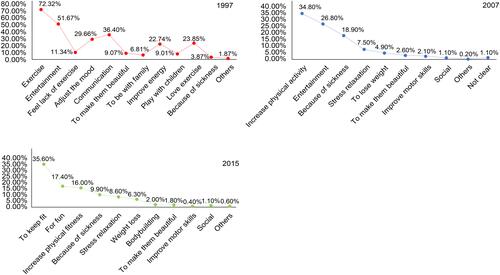
Figure 3 Sports venues development.
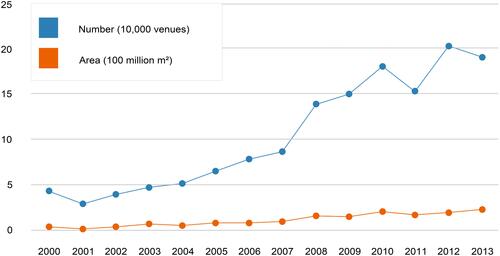
Table 7 Distribution of the Formal and Informal Physical Activity and Sports Places