
Figures & data
Table 1 Primers Used for PCR Amplification of Antibiotic Resistance Genes.Citation17
Table 2 Values of pH, Temperature, and Bacterial Load in Raw and Treated Sewage Samples
Table 3 Antimicrobial Susceptibility of MSSA and MRSA Isolates in Raw and Treated Sewage Samples
Figure 1 Comparison the antimicrobial susceptibility of S. aureus (MRSA and MSSA) isolates in raw (n=30) and treated (n=30) sewage samples.
Abbreviations: GEN, gentamicin; PEN, penicillin; AMC, amoxicillin/clavulanic acid; OXA, oxacillin; RIF, rifampicin; TET, tetracycline; AZM, azithromycin; CLI, clindamycin.
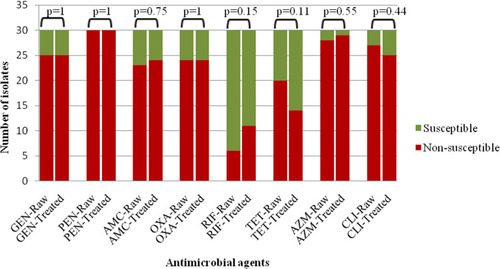
Figure 2 Frequency of multidrug-resistant S. aureus (MRSA and MSSA) isolates in raw (n=30) and treated (n=30) sewage samples.
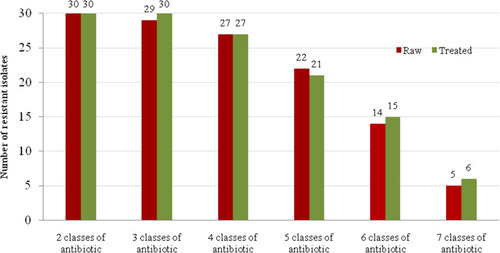
Table 4 Antibiotic Resistance Genes of MSSA and MRSA Isolates in Raw and Treated Sewage Samples