Figures & data
Table 1 Characteristics of the Subjects Under Study
Table 2 Characteristics of ESRD Patients According to Calcification Score
Figure 1 Box plot of presepsin (A) and serum phosphorus (B) in relation with CACs categories. Data shows an apparent increase in presepsin and phosphorus levels with increasing CACs up to 101–400 group in HD patients. (C) shows a significant correlation between CACs of 0–400 and log presepsin levels (p<0.05, R= 0.459), whereas in (D) no correlation was observed when all CACs and log presepsin levels were included.
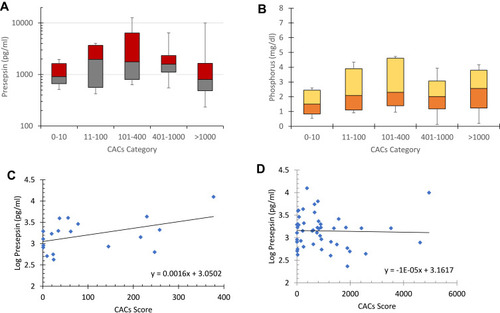
Figure 2 Correlation and linear regression analysis of log dialysis vintage and log CACs (A) or log presepsin levels (B) in HD patients is presented. A significant correlation between CACs and dialysis vintage was observed (p<0.05, R=0.342). When HD vintage was categorized, a significant correlation between 1–15 months of HD vintage and presepsin levels (p<0.05, R=0.482) (C) and between 1–20 months of HD vintage and CACs (p<0.05, R=0.425) (D) were observed.
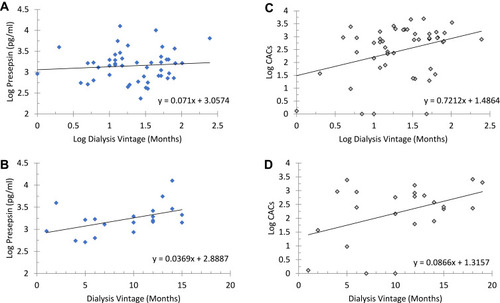
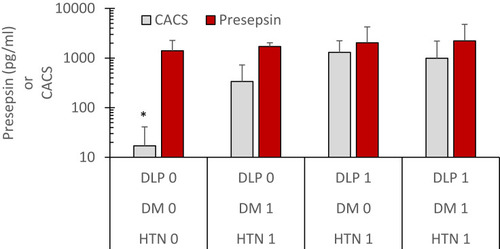
Figure 3 CACs and presepsin levels (mean ± SD) in groups categorized according to hypertension (HTN), dyslipidemia (DLP), and diabetes mellitus (DP) positive/negative conditions. CACs levels were significantly lower in patients with negative for HTN, DLP, and DM than patients having all the conditions combined (* p<0.05).