
Figures & data
Figure 1 The methods to identify studies based on the inclusion criteria.
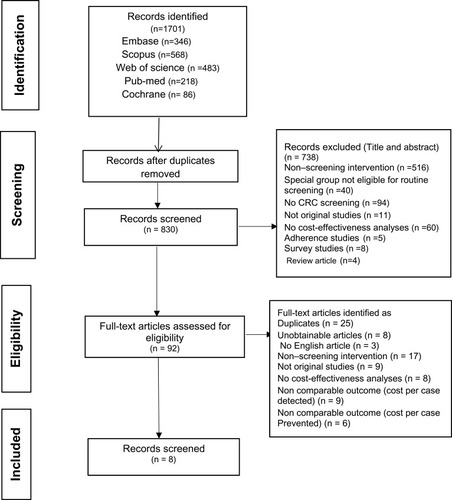
Table 1 The Characteristics of the Included Studies
Table 2 The Incremental Cost-Effectiveness Ratios of Different Techniques for CRC, in Contrast to the No-Screening Method
Table 3 The Calculated Incremental Cost-Effectiveness Ratios When Using FIT Yearly vs FIT Every 2-Year, and FOBT Yearly
Table 4 The Calculated Incremental Cost-Effectiveness Ratios When Using FIT Alone vs Flexible Sigmoidoscopy (FS)
Table 5 The Calculated Incremental Cost-Effectiveness Ratios When Using FOBT Alone vs Flexible Sigmoidoscopy (FS)
Table 6 The Calculated Incremental Cost-Effectiveness Ratios When Using FIT+ Sigmoidoscopy vs FIT
Table 7 The Calculated Incremental Cost-Effectiveness Ratios When Using Colonoscopy vs FIT and FOBT
Table 8 The Calculated Incremental Cost-Effectiveness Ratios When Using Colonoscopy vs FIT + Sigmoidoscopy
Table 9 The Calculated Incremental Cost-Effectiveness Ratios When Using Colonoscopy vs Stool DNA