
Figures & data
Figure 1 Flowchart of the patients who participated in the present study.
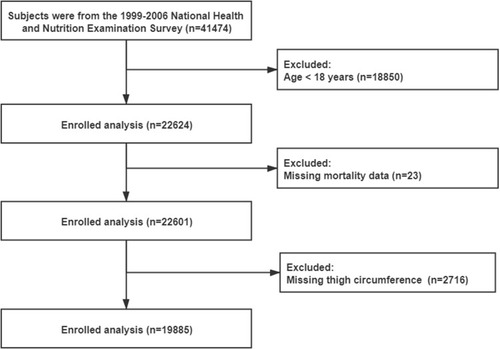
Table 1 Baseline Characteristics of the Study Participants by Quartiles of Thigh Circumference
Table 2 Multivariate Cox Regression Analysis for All-Cause, Cardiovascular and Cerebrovascular Mortality
Figure 2 Kaplan–Meier estimated cumulative survival curves based on thigh circumference groups.
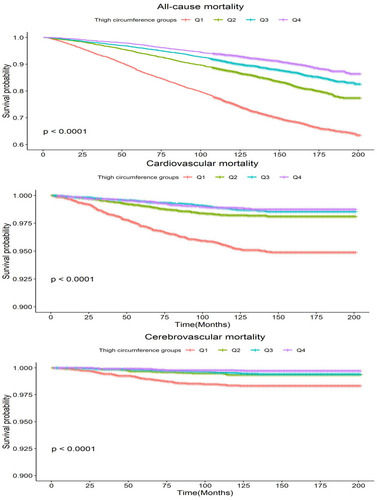
Figure 3 The relationship between thigh circumference and mortality of interest. The association of thigh circumference with all-cause mortality (A), cardiovascular mortality (B) and cerebrovascular mortality (C) were shown after controlling for age, gender, body mass index, waist circumference, moderate activity, total cholesterol, anti-diabetic drugs, estimated glomerular filtration rate, smoking status, race, baseline cancer, diabetes, hypertension, and cardiovascular diseases. The solid lines represented the hazard ratios of thigh circumference and the shadowed area represented the corresponding 95% confidence intervals.
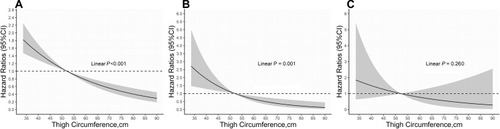
Table 3 Subgroup Analysis for Thigh Circumference with All-Cause and Cardiovascular Mortality
Table 4 Multivariate Cox Regression Analysis for All-Cause, Cardiovascular and Cerebrovascular Mortality by Excluding Participants with Any Cancer at Baseline