
Figures & data
Figure 1 Percentage of failed refill of lipid-lowering therapies prior to COVID-19 outbreak and in the first months afterwards (highlighted in red boxes).
Notes: ATC code of treatment analysed: C10A and C10B.
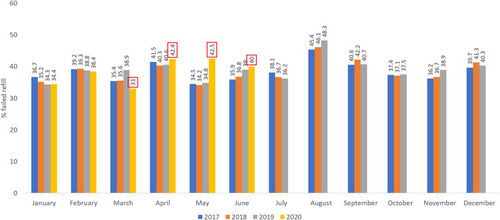
Figure 2 Percentage of failed refill of biologic therapies prior to COVID-19 outbreak and in the first months afterwards (highlighted in red boxes).
Notes: The analysis referred to patients treated with biologic therapies indicated for rheumatoid arthritis, psoriasis and Crohn’s disease, ATC code: L04AA24, L04AA33, L04AB01, L04AB02, L04AB04, L04AB05, L04AB06, L04AC03, L04AC05, L04AC07, L04AC08, L04AC10.
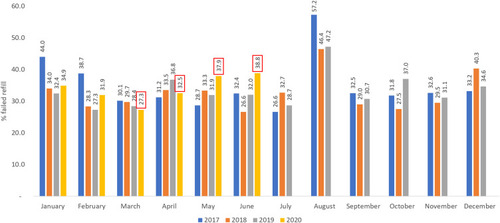
Table 1 Demographic Characteristics of Patients Included in the Preliminary Analysis Belonging to (a) Lipid-Lowering and (b) Biological Therapies
Table 2 Proportion of Patients That Failed to Refill (a) Lipid-Lowering and (b) Biologic Therapies Stratified by Age Range