Figures & data
Figure 1 Participants’ selection flowchart.
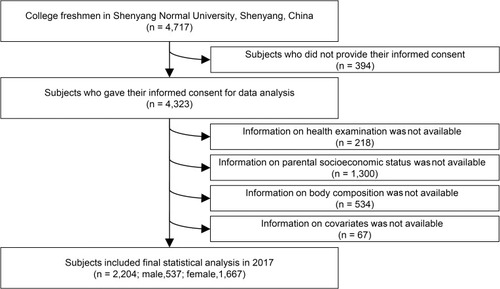
Table 1 Participants’ Characteristics According to Parental SES Scores in Chinese College Freshmen (n=2204)
Table 2 Association Between Total Parental SES Scores and Skeletal Muscle Mass in Chinese College Freshmen (n=2204)
Table 3 Association Between Total Paternal and Maternal SES Scores and Skeletal Muscle Mass in Chinese College Freshmen (n=2204)
Figure 2 Association of paternal and maternal socioeconomic status with skeletal muscle mass in Chinese college freshmen. Analysis of covariance was performed by adjusting for age (continuous variable), sex (male, female), ethnicity (Han ethnicity, others), smoking status (current smoker, former smoker, never smoker), alcohol use (yes, no), and daily sleep duration (<6, 6–7, 7–8, ≥8 hours). Data are presented as mean and 95% confidence interval.
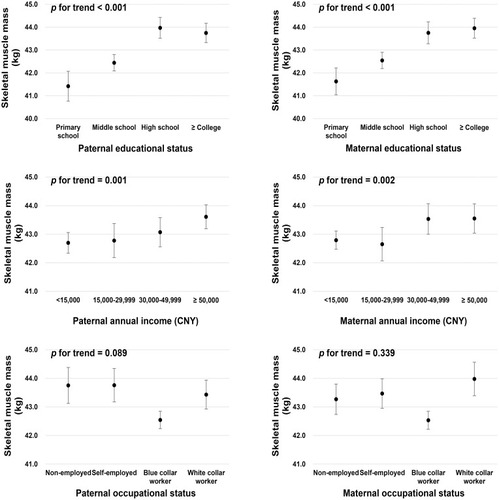
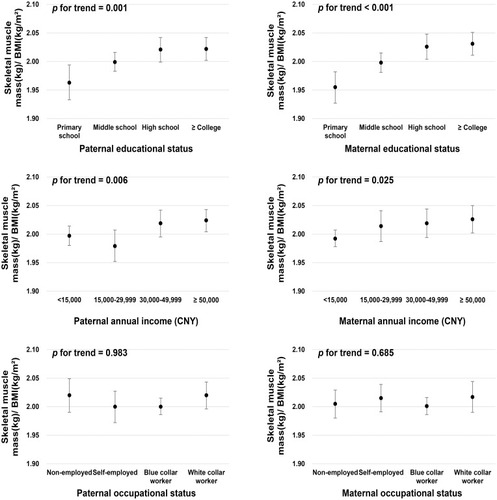
Figure 3 Association of paternal and maternal socioeconomic status with skeletal muscle mass adjusted by BMI in Chinese college freshmen. Analysis of covariance was performed by adjusting for age (continuous variable), sex (male, female), ethnicity (Han ethnicity, others), smoking status (current smoker, former smoker, never smoker), alcohol use (yes, no), and daily sleep duration (<6, 6–7, 7–8, ≥8 hours). Data are presented as mean and 95% confidence interval. BMI, body mass index.