
Figures & data
Table 1 Socio-Demographic Characteristics of Health Professionals Working in Public University Hospitals in Ethiopia, May 2020 (n = 273)
Figure 1 Most common source of information used by health professionals working in public university hospitals in Ethiopia (n = 273).
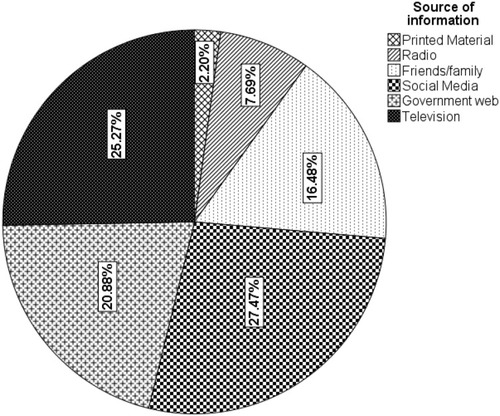
Table 2 Knowledge Related to COVID-19 of Health Professionals Working in Public University Hospitals in Ethiopia, May 2020 (n = 273)
Figure 2 Mean score (on a 5-point Likert scale) of specific precautionary health behavior practice of health professionals working in Ethiopia University Hospitals, May 2020 (n = 273).
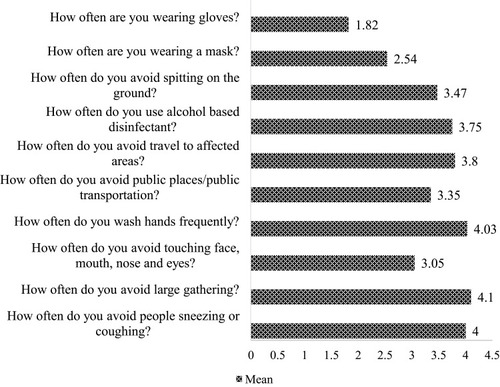
Table 3 Adjusted Multiple Regression Analysis Showing Factors Independently Associated with Precautionary Health Behavior by Health Professionals Working in Public University Hospitals in Ethiopia (n = 273)