
Figures & data
Figure 1 A detailed flow chart of describing the participants included in this study.
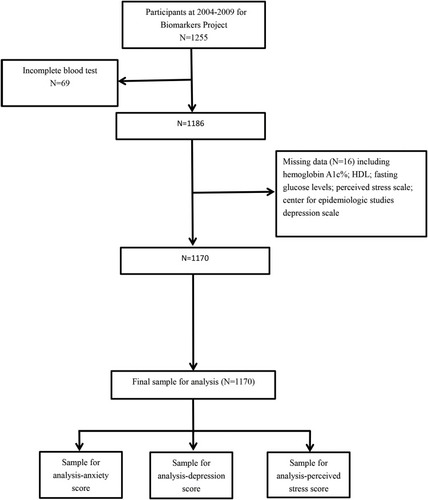
Figure 2 (A) The relationship between BMI and anxiety scores. (B) The relationship between BMI and depression scores. (C) The relationship between BMI and perceived stress scores.
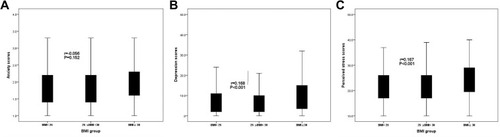
Table 1 Participants’ Characteristics
Table 2 Univariate Analysis of Relationships Between Inflammation and Anxiety, Depression and Perceived Stress Scores
Table 3 Adjusted Associations of Inflammatory Markers with Anxiety, Depression and Perceived Stress Scores
Table 4 Adjusted Associations of Inflammatory Markers with Anxiety, Depression and Perceived Stress Scores by Analysis of Stratified BMI