
Figures & data
Table 1 The Prevalence of Vitamin D Deficiency in West China
Table 2 The 25-OH-Vitamin D Levels (Nmol/L) in Different Groups
Figure 1 The fluctuations of Vitamin D levels throughout a year with different environmental factors.
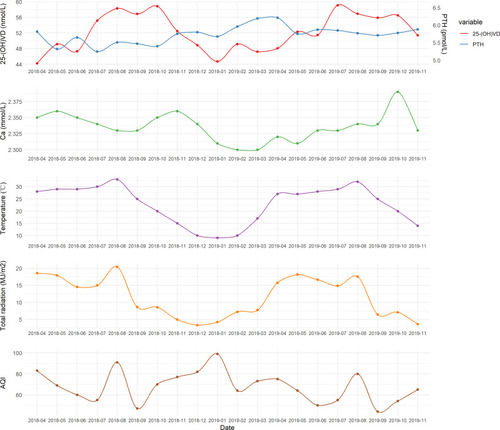
Figure 2 The prevalence of VDD in a different environment. (A) Vitamin D deficiency is the lowest in summer and autumn. (B, C) With the increase of total radiation and net radiation, the sufficient proportion of Vitamin D increased, while the percentage of insufficient and deficiency decreased. (D) In the heavy pollution, Vitamin D deficiency was worst, while in the excellent AQI, the status of sufficient Vitamin D was the best.
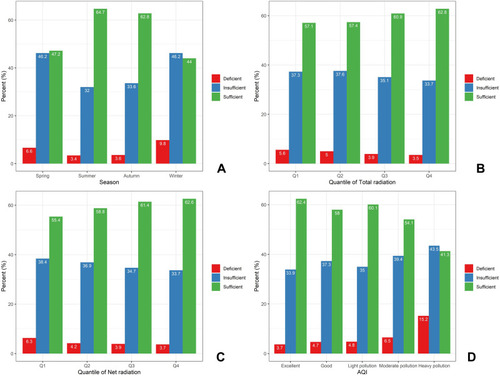
Table 3 Univariable and Multivariable Linear Regression of VD