Figures & data
Table 1 Summary of Study Design, Data Requirements, Assumptions and Extensions of Three Statistical Approaches for Modelling the Impact of an Intervention
Table 2 Estimated Impact of Medicaid Expansion on Health Insurance Coverage Under Different DID Models
Figure 1 Trend in health insurance coverage in a low-income population in the United States from 2012 to 2017.
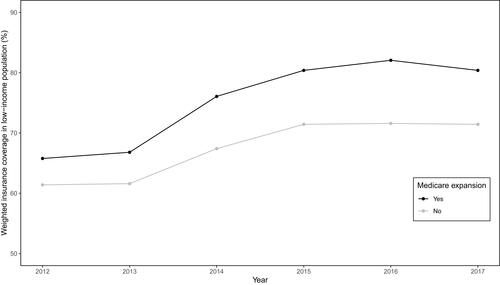
Table 3 Estimates from a Comparative Segmented Regression of ITS Analysis for Assessing the Impact of an ACR Select Tool in Increasing the Mean Appropriateness Score of High-Cost Imaging Orders
Figure 2 Mean scores and predicted regression line for appropriateness scores of imaging orders in an emergency department setting versus an inpatient setting over time.
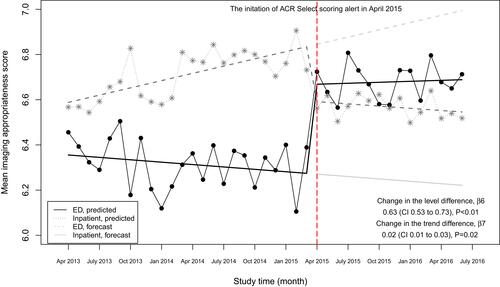
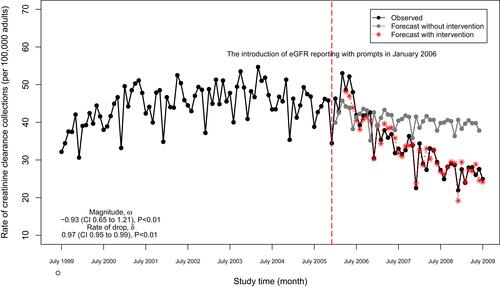
Table 4 Parameter Estimates from a SARIMA Model with Intervention in Examining the Effects of eGFR Reporting with Prompts on Physician Requests for Creatinine Clearance Collection in Ontario, Canada
Figure 3 Monthly numbers of 24-hour creatinine clearance collections in Ontario, Canada (adjusted for age and sex) and post-intervention forecast value.