
Figures & data
Figure 1 Mixed methods design: Qualitative (N= 56) and quantitative (N=768) strands with data collection and analysis procedures.
Abbreviations: FGDs, Focus Group Discussions; HBM, Health Belief Model; CVI, Content Validity Index; RA, Reliability Analysis; EFA, Exploratory Factor Analysis; CFA, Confirmatory Factor Analysis.
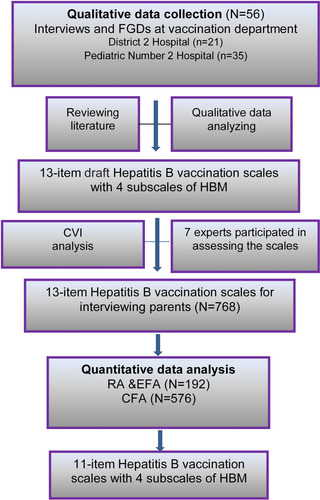
Table 1 Sex, Age, and Education of Participants (N=768)
Table 2 Internal Consistency Reliability of the Attitude Scales Towards Hepatitis B Vaccination (N=192)
Table 3 Exploratory Factor Analysis for Attitude Scales Towards Hepatitis B Vaccination (N=192)
Figure 2 Confirm factor analysis for Attitude Scales towards Hepatitis B Vaccination (N=576).
Notes: Oval, Endogenous variable; Value in oval, Standardized variance; Rectangle, Exogenous variables; Value in rectangle, intercept; ɛ, random errors; Value on one-way arrows are standardized factor loading; Value on two-way arrows show Covariances.
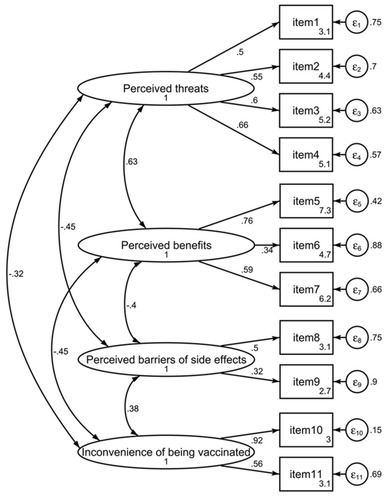
Table 4 Fit Statistic for CFA Model (N=576)