
Figures & data
Table 1 Descriptive Statistics of CBC Test Items
Figure 1 Comparison chart of Level-1 PLT count detection value.
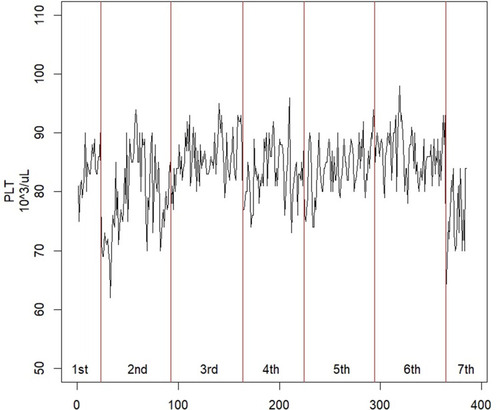
Table 2 Levene’s Variant Homogenous Test Analysis of Variance Table
Figure 2 Control chart of the platelet count detected in the low-concentration reagent with a new batch number before and after adjustment.
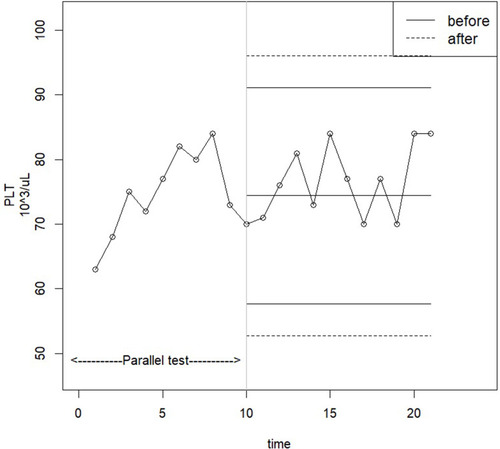
Figure 3 Control chart of the platelet count detected in the medium-concentration reagent with a new batch number before and after adjustment.
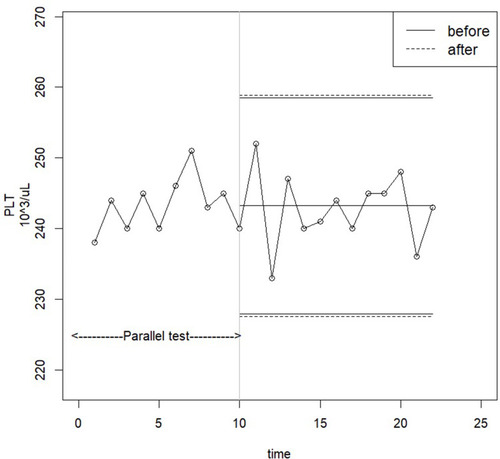
Figure 4 Control chart of the platelet count detected in the high-concentration reagent with a new batch number before and after adjustment.
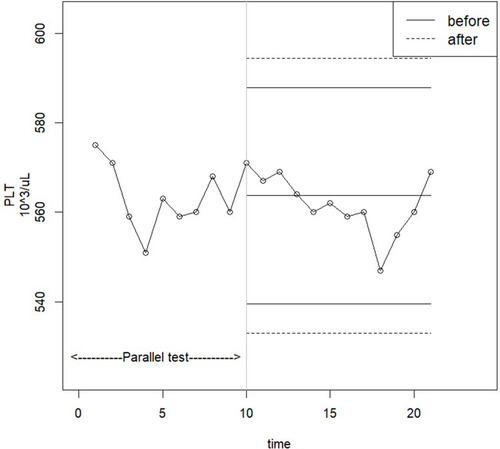
Table 3 ARLs of Detected Platelet Counts at Different Concentrations and at Controlled and Uncontrolled States