
Figures & data
Table 1 Characteristics of the Study Population
Table 2 Premenopause and Natural Menopause Status in Jordanian Women
Figure 1 The percentage distribution of menopause in Jordanian women, according to the cessation of menstruation age onset.
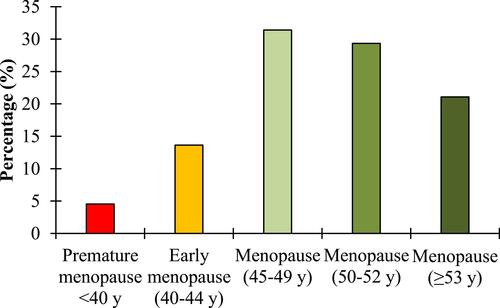
Table 3 FSH and E2 Levels in Premenopausal, Perimenopausal, Menopausal Age Groups of Jordanian Women
Table 4 Mean Scores of the Frequency of Vasomotor, Psychosocial, and Physical Symptoms with the Mean Score of Overall Health
Table 5 Selected Variables That May Associate with Premature/Early Menopause in Jordanian Women Comparison to Regular/Late Menopause Adjusted with Age Using Logistic Regression Analysis
Table 6 Multinomial Logistic Regression of Variables Associated with Premature/Early Menopause* with Adjusted or Against Age and Socioeconomic Factorsϯ