Figures & data
Figure 1 Inclusion and exclusion criteria of patients with gastric cancer.
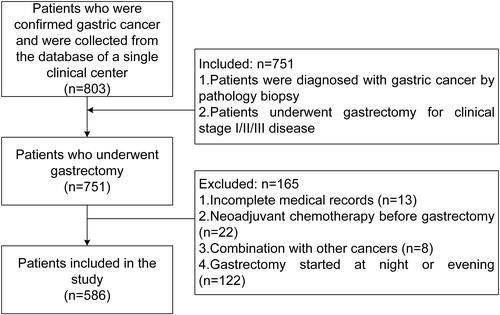
Table 1 Clinical Characteristics of the Patients
Table 2 Outcomes of Midday and Non-Midday Groups
Table 3 Outcomes of Different Season
Table 4 Outcomes of Short and Long Preoperative Waiting Time Groups
Table 5 Multivariate Analyses for the Identification of Independent Prognostic Factors for Overall Survival in All Clinical Stage Gastric Cancer
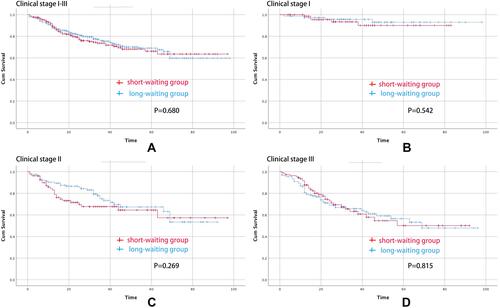
Figure 2 Overall survival curves for patients undergoing gastrectomy. (A) Overall survival curves for the waiting groups among all patients. (B) Overall survival curves for the waiting groups among clinical stage I patients. (C) Overall survival curves for the waiting groups among clinical stage II patients. (D) Overall survival curves for the waiting groups among clinical stage III patients.